Immigrants from Austria vs Samoan 4th Grade
COMPARE
Immigrants from Austria
Samoan
4th Grade
4th Grade Comparison
Immigrants from Austria
Samoans
98.0%
4TH GRADE
99.6/ 100
METRIC RATING
70th/ 347
METRIC RANK
97.3%
4TH GRADE
6.8/ 100
METRIC RATING
216th/ 347
METRIC RANK
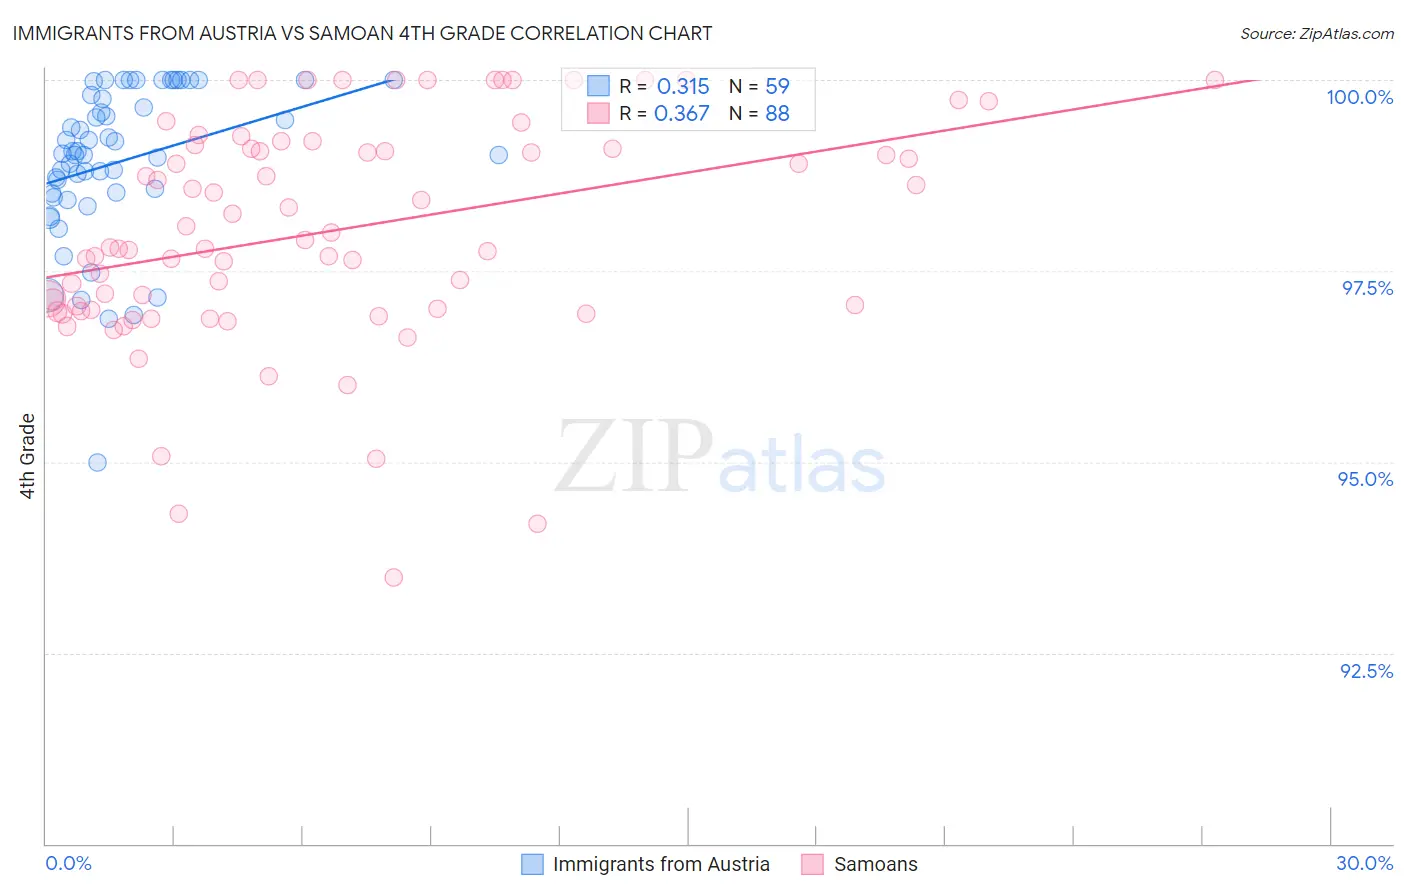
Immigrants from Austria vs Samoan 4th Grade Correlation Chart
The statistical analysis conducted on geographies consisting of 167,973,800 people shows a mild positive correlation between the proportion of Immigrants from Austria and percentage of population with at least 4th grade education in the United States with a correlation coefficient (R) of 0.315 and weighted average of 98.0%. Similarly, the statistical analysis conducted on geographies consisting of 225,205,818 people shows a mild positive correlation between the proportion of Samoans and percentage of population with at least 4th grade education in the United States with a correlation coefficient (R) of 0.367 and weighted average of 97.3%, a difference of 0.77%.
4th Grade Correlation Summary
| Measurement | Immigrants from Austria | Samoan |
| Minimum | 95.0% | 93.5% |
| Maximum | 100.0% | 100.0% |
| Range | 5.0% | 6.5% |
| Mean | 98.9% | 98.0% |
| Median | 99.0% | 97.9% |
| Interquartile 25% (IQ1) | 98.5% | 97.0% |
| Interquartile 75% (IQ3) | 99.8% | 99.1% |
| Interquartile Range (IQR) | 1.3% | 2.1% |
| Standard Deviation (Sample) | 1.0% | 1.5% |
| Standard Deviation (Population) | 1.0% | 1.5% |
Similar Demographics by 4th Grade
Demographics Similar to Immigrants from Austria by 4th Grade
In terms of 4th grade, the demographic groups most similar to Immigrants from Austria are Kiowa (98.0%, a difference of 0.0%), Pueblo (98.0%, a difference of 0.0%), Lumbee (98.0%, a difference of 0.0%), Immigrants from Northern Europe (98.0%, a difference of 0.010%), and Canadian (98.0%, a difference of 0.010%).
| Demographics | Rating | Rank | 4th Grade |
| Russians | 99.7 /100 | #63 | Exceptional 98.0% |
| Cajuns | 99.7 /100 | #64 | Exceptional 98.0% |
| Immigrants | Northern Europe | 99.6 /100 | #65 | Exceptional 98.0% |
| Canadians | 99.6 /100 | #66 | Exceptional 98.0% |
| New Zealanders | 99.6 /100 | #67 | Exceptional 98.0% |
| Kiowa | 99.6 /100 | #68 | Exceptional 98.0% |
| Pueblo | 99.6 /100 | #69 | Exceptional 98.0% |
| Immigrants | Austria | 99.6 /100 | #70 | Exceptional 98.0% |
| Lumbee | 99.6 /100 | #71 | Exceptional 98.0% |
| Iranians | 99.4 /100 | #72 | Exceptional 98.0% |
| Macedonians | 99.4 /100 | #73 | Exceptional 98.0% |
| Chickasaw | 99.4 /100 | #74 | Exceptional 98.0% |
| Immigrants | Netherlands | 99.3 /100 | #75 | Exceptional 98.0% |
| Cherokee | 99.3 /100 | #76 | Exceptional 98.0% |
| Immigrants | Lithuania | 99.3 /100 | #77 | Exceptional 98.0% |
Demographics Similar to Samoans by 4th Grade
In terms of 4th grade, the demographic groups most similar to Samoans are Immigrants from Morocco (97.3%, a difference of 0.0%), Sierra Leonean (97.3%, a difference of 0.0%), Immigrants from Nepal (97.3%, a difference of 0.010%), Iraqi (97.3%, a difference of 0.010%), and Tohono O'odham (97.3%, a difference of 0.020%).
| Demographics | Rating | Rank | 4th Grade |
| Laotians | 9.3 /100 | #209 | Tragic 97.3% |
| Immigrants | Oceania | 9.1 /100 | #210 | Tragic 97.3% |
| Sudanese | 9.0 /100 | #211 | Tragic 97.3% |
| Tohono O'odham | 8.4 /100 | #212 | Tragic 97.3% |
| Costa Ricans | 8.3 /100 | #213 | Tragic 97.3% |
| Immigrants | Nepal | 7.7 /100 | #214 | Tragic 97.3% |
| Immigrants | Morocco | 7.1 /100 | #215 | Tragic 97.3% |
| Samoans | 6.8 /100 | #216 | Tragic 97.3% |
| Sierra Leoneans | 6.5 /100 | #217 | Tragic 97.3% |
| Iraqis | 6.3 /100 | #218 | Tragic 97.3% |
| Tongans | 5.8 /100 | #219 | Tragic 97.3% |
| South American Indians | 5.5 /100 | #220 | Tragic 97.3% |
| Immigrants | Panama | 5.4 /100 | #221 | Tragic 97.3% |
| Immigrants | Lebanon | 5.1 /100 | #222 | Tragic 97.3% |
| Immigrants | Sudan | 5.0 /100 | #223 | Tragic 97.2% |