Immigrants from Australia vs Immigrants from Eastern Asia Ambulatory Disability
COMPARE
Immigrants from Australia
Immigrants from Eastern Asia
Ambulatory Disability
Ambulatory Disability Comparison
Immigrants from Australia
Immigrants from Eastern Asia
5.5%
AMBULATORY DISABILITY
100.0/ 100
METRIC RATING
32nd/ 347
METRIC RANK
5.3%
AMBULATORY DISABILITY
100.0/ 100
METRIC RATING
14th/ 347
METRIC RANK
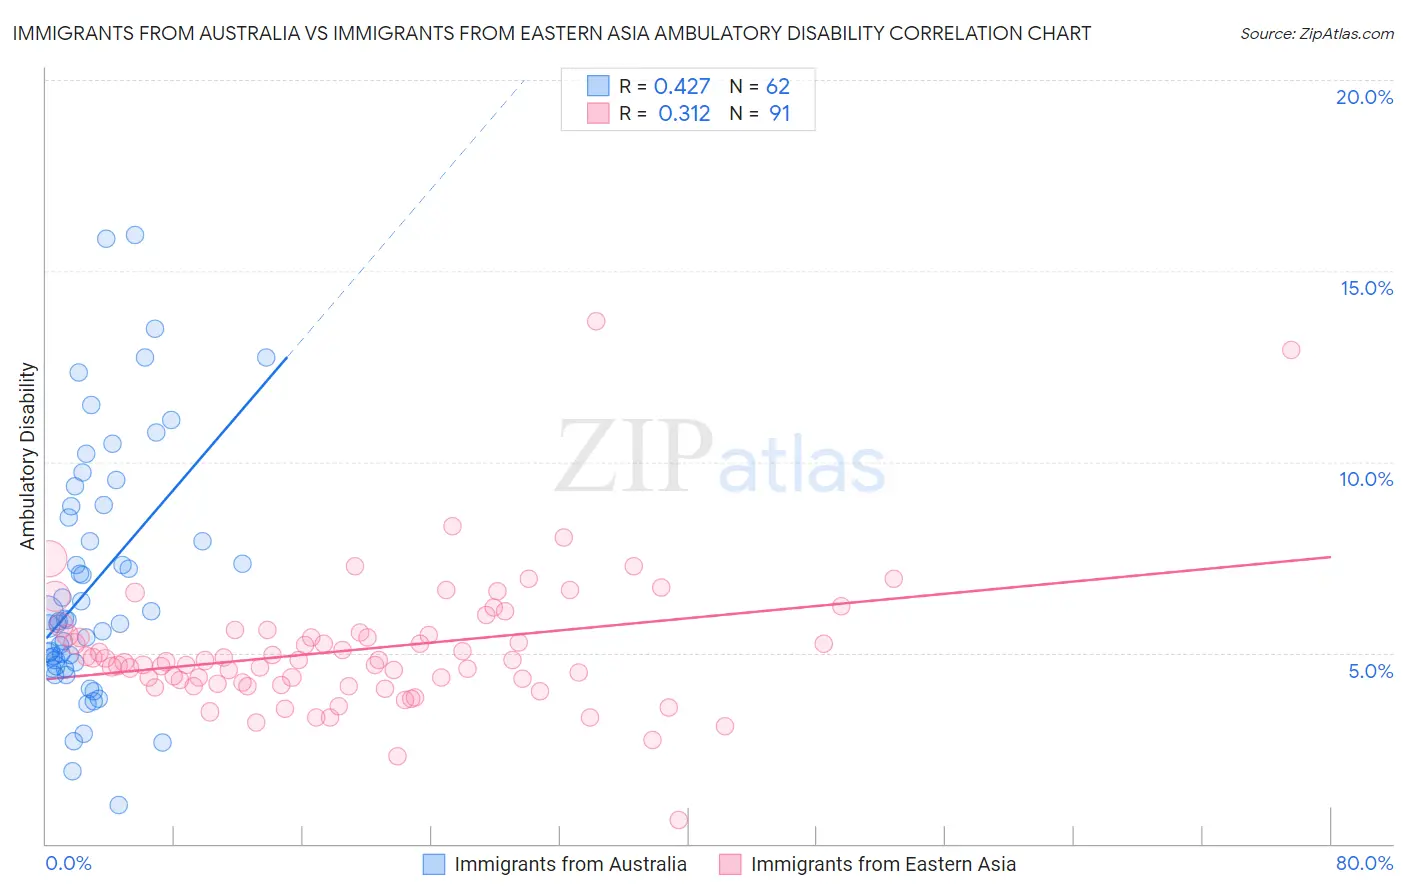
Immigrants from Australia vs Immigrants from Eastern Asia Ambulatory Disability Correlation Chart
The statistical analysis conducted on geographies consisting of 227,168,976 people shows a moderate positive correlation between the proportion of Immigrants from Australia and percentage of population with ambulatory disability in the United States with a correlation coefficient (R) of 0.427 and weighted average of 5.5%. Similarly, the statistical analysis conducted on geographies consisting of 499,616,873 people shows a mild positive correlation between the proportion of Immigrants from Eastern Asia and percentage of population with ambulatory disability in the United States with a correlation coefficient (R) of 0.312 and weighted average of 5.3%, a difference of 3.1%.
Ambulatory Disability Correlation Summary
| Measurement | Immigrants from Australia | Immigrants from Eastern Asia |
| Minimum | 1.0% | 0.61% |
| Maximum | 15.9% | 13.7% |
| Range | 14.9% | 13.1% |
| Mean | 6.8% | 5.1% |
| Median | 5.8% | 4.8% |
| Interquartile 25% (IQ1) | 4.7% | 4.2% |
| Interquartile 75% (IQ3) | 8.9% | 5.5% |
| Interquartile Range (IQR) | 4.1% | 1.3% |
| Standard Deviation (Sample) | 3.3% | 1.8% |
| Standard Deviation (Population) | 3.2% | 1.7% |
Demographics Similar to Immigrants from Australia and Immigrants from Eastern Asia by Ambulatory Disability
In terms of ambulatory disability, the demographic groups most similar to Immigrants from Australia are Immigrants from Pakistan (5.5%, a difference of 0.12%), Immigrants from Venezuela (5.4%, a difference of 0.17%), Immigrants from Turkey (5.4%, a difference of 0.19%), Immigrants from Iran (5.4%, a difference of 0.80%), and Cambodian (5.4%, a difference of 0.91%). Similarly, the demographic groups most similar to Immigrants from Eastern Asia are Burmese (5.3%, a difference of 0.15%), Immigrants from China (5.3%, a difference of 0.33%), Immigrants from Hong Kong (5.3%, a difference of 0.87%), Immigrants from Ethiopia (5.4%, a difference of 1.2%), and Immigrants from Sri Lanka (5.4%, a difference of 1.2%).
| Demographics | Rating | Rank | Ambulatory Disability |
| Burmese | 100.0 /100 | #13 | Exceptional 5.3% |
| Immigrants | Eastern Asia | 100.0 /100 | #14 | Exceptional 5.3% |
| Immigrants | China | 100.0 /100 | #15 | Exceptional 5.3% |
| Immigrants | Hong Kong | 100.0 /100 | #16 | Exceptional 5.3% |
| Immigrants | Ethiopia | 100.0 /100 | #17 | Exceptional 5.4% |
| Immigrants | Sri Lanka | 100.0 /100 | #18 | Exceptional 5.4% |
| Indians (Asian) | 100.0 /100 | #19 | Exceptional 5.4% |
| Ethiopians | 100.0 /100 | #20 | Exceptional 5.4% |
| Immigrants | Kuwait | 100.0 /100 | #21 | Exceptional 5.4% |
| Immigrants | Israel | 100.0 /100 | #22 | Exceptional 5.4% |
| Tongans | 100.0 /100 | #23 | Exceptional 5.4% |
| Immigrants | Saudi Arabia | 100.0 /100 | #24 | Exceptional 5.4% |
| Zimbabweans | 100.0 /100 | #25 | Exceptional 5.4% |
| Immigrants | Nepal | 100.0 /100 | #26 | Exceptional 5.4% |
| Asians | 100.0 /100 | #27 | Exceptional 5.4% |
| Cambodians | 100.0 /100 | #28 | Exceptional 5.4% |
| Immigrants | Iran | 100.0 /100 | #29 | Exceptional 5.4% |
| Immigrants | Turkey | 100.0 /100 | #30 | Exceptional 5.4% |
| Immigrants | Venezuela | 100.0 /100 | #31 | Exceptional 5.4% |
| Immigrants | Australia | 100.0 /100 | #32 | Exceptional 5.5% |
| Immigrants | Pakistan | 100.0 /100 | #33 | Exceptional 5.5% |