Immigrants from Australia vs Belgian In Labor Force | Age 30-34
COMPARE
Immigrants from Australia
Belgian
In Labor Force | Age 30-34
In Labor Force | Age 30-34 Comparison
Immigrants from Australia
Belgians
85.6%
IN LABOR FORCE | AGE 30-34
99.8/ 100
METRIC RATING
50th/ 347
METRIC RANK
85.2%
IN LABOR FORCE | AGE 30-34
97.2/ 100
METRIC RATING
99th/ 347
METRIC RANK
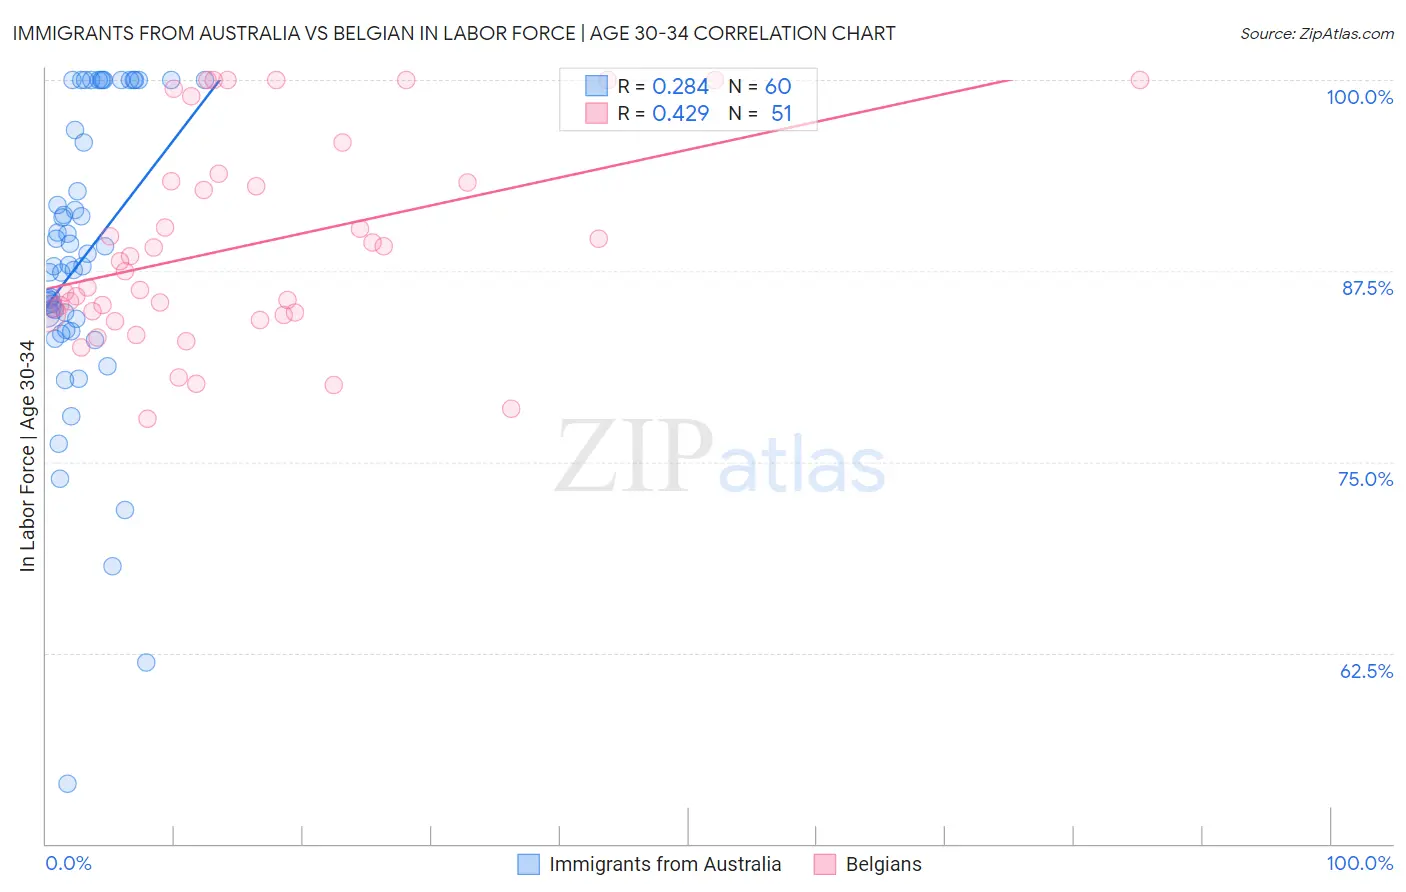
Immigrants from Australia vs Belgian In Labor Force | Age 30-34 Correlation Chart
The statistical analysis conducted on geographies consisting of 227,147,173 people shows a weak positive correlation between the proportion of Immigrants from Australia and labor force participation rate among population between the ages 30 and 34 in the United States with a correlation coefficient (R) of 0.284 and weighted average of 85.6%. Similarly, the statistical analysis conducted on geographies consisting of 355,822,490 people shows a moderate positive correlation between the proportion of Belgians and labor force participation rate among population between the ages 30 and 34 in the United States with a correlation coefficient (R) of 0.429 and weighted average of 85.2%, a difference of 0.44%.
In Labor Force | Age 30-34 Correlation Summary
| Measurement | Immigrants from Australia | Belgian |
| Minimum | 53.9% | 77.8% |
| Maximum | 100.0% | 100.0% |
| Range | 46.1% | 22.2% |
| Mean | 88.3% | 89.1% |
| Median | 87.9% | 87.5% |
| Interquartile 25% (IQ1) | 84.0% | 84.7% |
| Interquartile 75% (IQ3) | 98.4% | 93.3% |
| Interquartile Range (IQR) | 14.4% | 8.6% |
| Standard Deviation (Sample) | 9.8% | 6.6% |
| Standard Deviation (Population) | 9.7% | 6.5% |
Similar Demographics by In Labor Force | Age 30-34
Demographics Similar to Immigrants from Australia by In Labor Force | Age 30-34
In terms of in labor force | age 30-34, the demographic groups most similar to Immigrants from Australia are Immigrants from Sweden (85.6%, a difference of 0.010%), Lithuanian (85.6%, a difference of 0.010%), Cape Verdean (85.6%, a difference of 0.020%), Immigrants from Morocco (85.6%, a difference of 0.030%), and Croatian (85.6%, a difference of 0.030%).
| Demographics | Rating | Rank | In Labor Force | Age 30-34 |
| Immigrants | Lithuania | 99.8 /100 | #43 | Exceptional 85.6% |
| Immigrants | Sri Lanka | 99.8 /100 | #44 | Exceptional 85.6% |
| Immigrants | Nepal | 99.8 /100 | #45 | Exceptional 85.6% |
| Immigrants | Morocco | 99.8 /100 | #46 | Exceptional 85.6% |
| Croatians | 99.8 /100 | #47 | Exceptional 85.6% |
| Immigrants | Sweden | 99.8 /100 | #48 | Exceptional 85.6% |
| Lithuanians | 99.8 /100 | #49 | Exceptional 85.6% |
| Immigrants | Australia | 99.8 /100 | #50 | Exceptional 85.6% |
| Cape Verdeans | 99.7 /100 | #51 | Exceptional 85.6% |
| Slovenes | 99.7 /100 | #52 | Exceptional 85.6% |
| Filipinos | 99.6 /100 | #53 | Exceptional 85.5% |
| Immigrants | Kenya | 99.6 /100 | #54 | Exceptional 85.5% |
| Immigrants | Turkey | 99.6 /100 | #55 | Exceptional 85.5% |
| Czechs | 99.6 /100 | #56 | Exceptional 85.5% |
| Russians | 99.6 /100 | #57 | Exceptional 85.5% |
Demographics Similar to Belgians by In Labor Force | Age 30-34
In terms of in labor force | age 30-34, the demographic groups most similar to Belgians are Thai (85.2%, a difference of 0.0%), Immigrants from Uganda (85.2%, a difference of 0.0%), Sudanese (85.2%, a difference of 0.0%), Immigrants from Korea (85.2%, a difference of 0.010%), and Immigrants from Belarus (85.2%, a difference of 0.010%).
| Demographics | Rating | Rank | In Labor Force | Age 30-34 |
| German Russians | 97.7 /100 | #92 | Exceptional 85.2% |
| Immigrants | Norway | 97.6 /100 | #93 | Exceptional 85.2% |
| Swedes | 97.5 /100 | #94 | Exceptional 85.2% |
| Immigrants | India | 97.4 /100 | #95 | Exceptional 85.2% |
| Immigrants | Korea | 97.3 /100 | #96 | Exceptional 85.2% |
| Thais | 97.2 /100 | #97 | Exceptional 85.2% |
| Immigrants | Uganda | 97.2 /100 | #98 | Exceptional 85.2% |
| Belgians | 97.2 /100 | #99 | Exceptional 85.2% |
| Sudanese | 97.1 /100 | #100 | Exceptional 85.2% |
| Immigrants | Belarus | 96.9 /100 | #101 | Exceptional 85.2% |
| Immigrants | Austria | 96.8 /100 | #102 | Exceptional 85.2% |
| Ukrainians | 96.6 /100 | #103 | Exceptional 85.2% |
| Immigrants | Ghana | 96.5 /100 | #104 | Exceptional 85.2% |
| Alsatians | 96.3 /100 | #105 | Exceptional 85.2% |
| Immigrants | Middle Africa | 96.3 /100 | #106 | Exceptional 85.2% |