Immigrants from Australia vs Immigrants from Egypt Ambulatory Disability
COMPARE
Immigrants from Australia
Immigrants from Egypt
Ambulatory Disability
Ambulatory Disability Comparison
Immigrants from Australia
Immigrants from Egypt
5.5%
AMBULATORY DISABILITY
100.0/ 100
METRIC RATING
32nd/ 347
METRIC RANK
5.6%
AMBULATORY DISABILITY
99.8/ 100
METRIC RATING
53rd/ 347
METRIC RANK
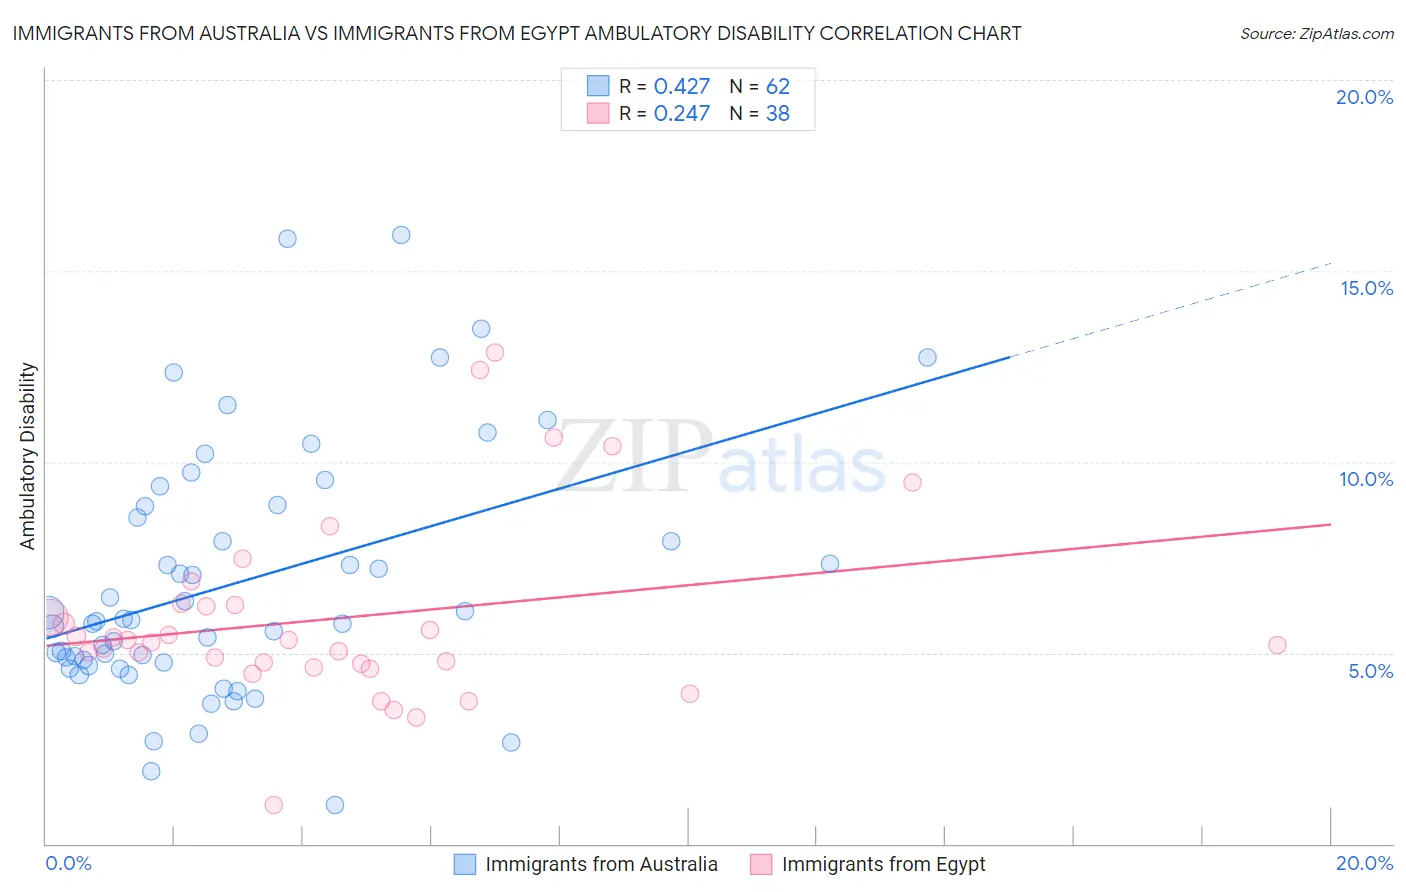
Immigrants from Australia vs Immigrants from Egypt Ambulatory Disability Correlation Chart
The statistical analysis conducted on geographies consisting of 227,168,976 people shows a moderate positive correlation between the proportion of Immigrants from Australia and percentage of population with ambulatory disability in the United States with a correlation coefficient (R) of 0.427 and weighted average of 5.5%. Similarly, the statistical analysis conducted on geographies consisting of 245,460,331 people shows a weak positive correlation between the proportion of Immigrants from Egypt and percentage of population with ambulatory disability in the United States with a correlation coefficient (R) of 0.247 and weighted average of 5.6%, a difference of 2.6%.
Ambulatory Disability Correlation Summary
| Measurement | Immigrants from Australia | Immigrants from Egypt |
| Minimum | 1.0% | 1.0% |
| Maximum | 15.9% | 12.9% |
| Range | 14.9% | 11.9% |
| Mean | 6.8% | 5.9% |
| Median | 5.8% | 5.3% |
| Interquartile 25% (IQ1) | 4.7% | 4.7% |
| Interquartile 75% (IQ3) | 8.9% | 6.2% |
| Interquartile Range (IQR) | 4.1% | 1.5% |
| Standard Deviation (Sample) | 3.3% | 2.4% |
| Standard Deviation (Population) | 3.2% | 2.4% |
Similar Demographics by Ambulatory Disability
Demographics Similar to Immigrants from Australia by Ambulatory Disability
In terms of ambulatory disability, the demographic groups most similar to Immigrants from Australia are Immigrants from Pakistan (5.5%, a difference of 0.12%), Immigrants from Venezuela (5.4%, a difference of 0.17%), Immigrants from Turkey (5.4%, a difference of 0.19%), Immigrants from Asia (5.5%, a difference of 0.28%), and Afghan (5.5%, a difference of 0.32%).
| Demographics | Rating | Rank | Ambulatory Disability |
| Zimbabweans | 100.0 /100 | #25 | Exceptional 5.4% |
| Immigrants | Nepal | 100.0 /100 | #26 | Exceptional 5.4% |
| Asians | 100.0 /100 | #27 | Exceptional 5.4% |
| Cambodians | 100.0 /100 | #28 | Exceptional 5.4% |
| Immigrants | Iran | 100.0 /100 | #29 | Exceptional 5.4% |
| Immigrants | Turkey | 100.0 /100 | #30 | Exceptional 5.4% |
| Immigrants | Venezuela | 100.0 /100 | #31 | Exceptional 5.4% |
| Immigrants | Australia | 100.0 /100 | #32 | Exceptional 5.5% |
| Immigrants | Pakistan | 100.0 /100 | #33 | Exceptional 5.5% |
| Immigrants | Asia | 100.0 /100 | #34 | Exceptional 5.5% |
| Afghans | 100.0 /100 | #35 | Exceptional 5.5% |
| Immigrants | Malaysia | 100.0 /100 | #36 | Exceptional 5.5% |
| Turks | 100.0 /100 | #37 | Exceptional 5.5% |
| Cypriots | 100.0 /100 | #38 | Exceptional 5.5% |
| Immigrants | Eritrea | 100.0 /100 | #39 | Exceptional 5.5% |
Demographics Similar to Immigrants from Egypt by Ambulatory Disability
In terms of ambulatory disability, the demographic groups most similar to Immigrants from Egypt are Jordanian (5.6%, a difference of 0.010%), Immigrants from Eastern Africa (5.6%, a difference of 0.050%), Taiwanese (5.6%, a difference of 0.10%), Immigrants from Bulgaria (5.6%, a difference of 0.11%), and Luxembourger (5.6%, a difference of 0.20%).
| Demographics | Rating | Rank | Ambulatory Disability |
| Egyptians | 99.9 /100 | #46 | Exceptional 5.6% |
| Immigrants | Japan | 99.9 /100 | #47 | Exceptional 5.6% |
| Immigrants | Argentina | 99.9 /100 | #48 | Exceptional 5.6% |
| Bulgarians | 99.9 /100 | #49 | Exceptional 5.6% |
| Luxembourgers | 99.9 /100 | #50 | Exceptional 5.6% |
| Taiwanese | 99.8 /100 | #51 | Exceptional 5.6% |
| Jordanians | 99.8 /100 | #52 | Exceptional 5.6% |
| Immigrants | Egypt | 99.8 /100 | #53 | Exceptional 5.6% |
| Immigrants | Eastern Africa | 99.8 /100 | #54 | Exceptional 5.6% |
| Immigrants | Bulgaria | 99.8 /100 | #55 | Exceptional 5.6% |
| Inupiat | 99.8 /100 | #56 | Exceptional 5.6% |
| Immigrants | Brazil | 99.8 /100 | #57 | Exceptional 5.6% |
| Immigrants | Zimbabwe | 99.8 /100 | #58 | Exceptional 5.6% |
| Immigrants | Afghanistan | 99.8 /100 | #59 | Exceptional 5.6% |
| Immigrants | Lithuania | 99.8 /100 | #60 | Exceptional 5.6% |