Immigrants from Argentina vs Immigrants from Jordan Unemployment
COMPARE
Immigrants from Argentina
Immigrants from Jordan
Unemployment
Unemployment Comparison
Immigrants from Argentina
Immigrants from Jordan
5.0%
UNEMPLOYMENT
94.1/ 100
METRIC RATING
102nd/ 347
METRIC RANK
5.1%
UNEMPLOYMENT
86.6/ 100
METRIC RATING
133rd/ 347
METRIC RANK
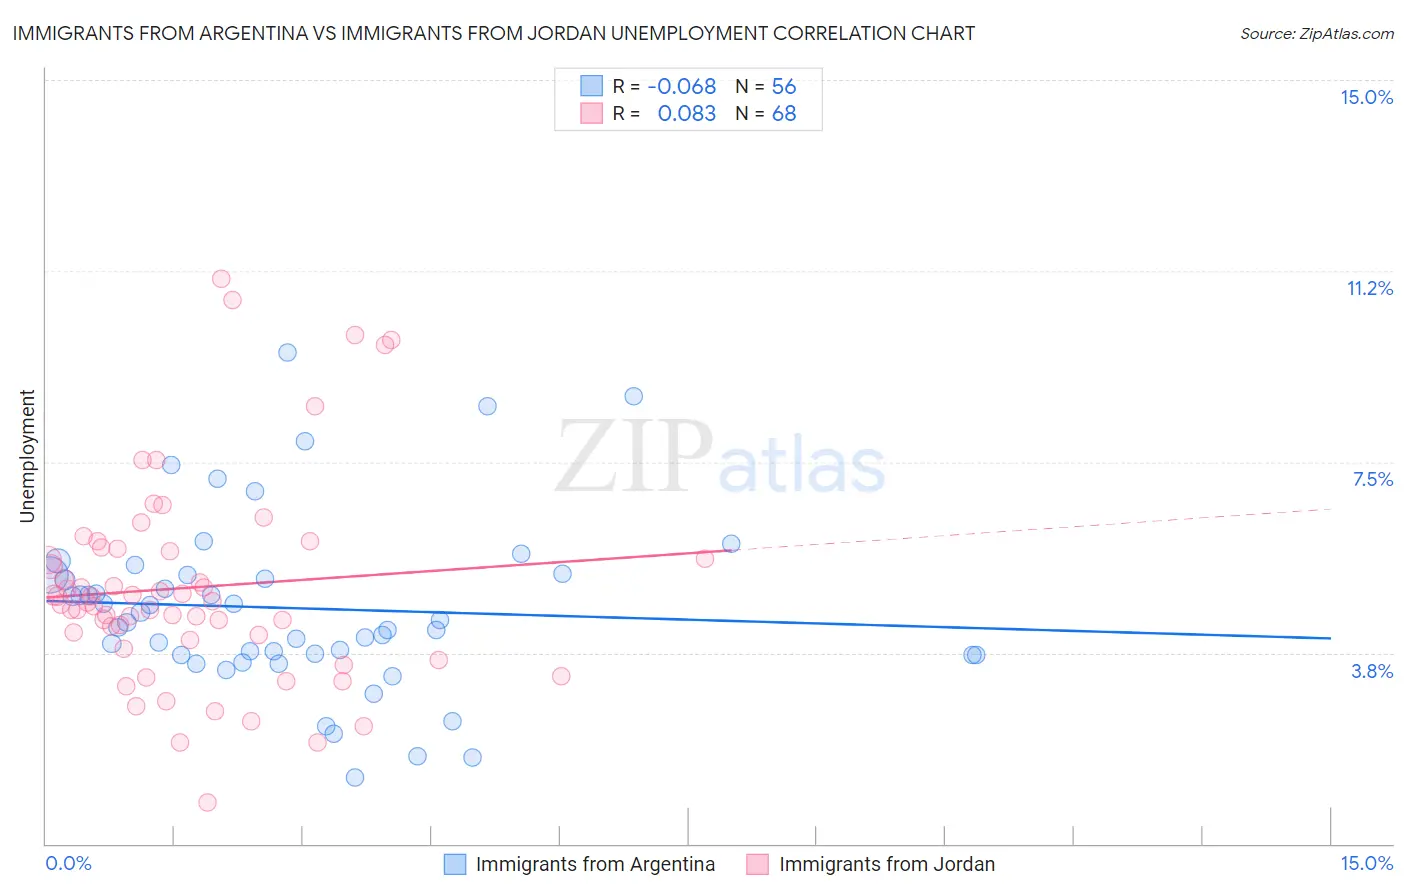
Immigrants from Argentina vs Immigrants from Jordan Unemployment Correlation Chart
The statistical analysis conducted on geographies consisting of 264,363,523 people shows a slight negative correlation between the proportion of Immigrants from Argentina and unemployment in the United States with a correlation coefficient (R) of -0.068 and weighted average of 5.0%. Similarly, the statistical analysis conducted on geographies consisting of 181,256,690 people shows a slight positive correlation between the proportion of Immigrants from Jordan and unemployment in the United States with a correlation coefficient (R) of 0.083 and weighted average of 5.1%, a difference of 1.5%.
Unemployment Correlation Summary
| Measurement | Immigrants from Argentina | Immigrants from Jordan |
| Minimum | 1.3% | 0.80% |
| Maximum | 9.7% | 11.1% |
| Range | 8.4% | 10.3% |
| Mean | 4.6% | 5.0% |
| Median | 4.4% | 4.7% |
| Interquartile 25% (IQ1) | 3.7% | 4.1% |
| Interquartile 75% (IQ3) | 5.3% | 5.8% |
| Interquartile Range (IQR) | 1.6% | 1.7% |
| Standard Deviation (Sample) | 1.7% | 2.0% |
| Standard Deviation (Population) | 1.7% | 2.0% |
Similar Demographics by Unemployment
Demographics Similar to Immigrants from Argentina by Unemployment
In terms of unemployment, the demographic groups most similar to Immigrants from Argentina are Chickasaw (5.0%, a difference of 0.040%), Osage (5.0%, a difference of 0.040%), Maltese (5.0%, a difference of 0.040%), American (5.0%, a difference of 0.050%), and Immigrants from Romania (5.0%, a difference of 0.11%).
| Demographics | Rating | Rank | Unemployment |
| Immigrants | Serbia | 95.6 /100 | #95 | Exceptional 5.0% |
| Immigrants | England | 95.2 /100 | #96 | Exceptional 5.0% |
| Immigrants | Czechoslovakia | 95.1 /100 | #97 | Exceptional 5.0% |
| Romanians | 95.0 /100 | #98 | Exceptional 5.0% |
| Mongolians | 94.8 /100 | #99 | Exceptional 5.0% |
| Estonians | 94.6 /100 | #100 | Exceptional 5.0% |
| Americans | 94.3 /100 | #101 | Exceptional 5.0% |
| Immigrants | Argentina | 94.1 /100 | #102 | Exceptional 5.0% |
| Chickasaw | 94.0 /100 | #103 | Exceptional 5.0% |
| Osage | 94.0 /100 | #104 | Exceptional 5.0% |
| Maltese | 94.0 /100 | #105 | Exceptional 5.0% |
| Immigrants | Romania | 93.7 /100 | #106 | Exceptional 5.0% |
| Immigrants | Turkey | 93.7 /100 | #107 | Exceptional 5.0% |
| Immigrants | Kuwait | 93.7 /100 | #108 | Exceptional 5.0% |
| Immigrants | Eritrea | 93.3 /100 | #109 | Exceptional 5.0% |
Demographics Similar to Immigrants from Jordan by Unemployment
In terms of unemployment, the demographic groups most similar to Immigrants from Jordan are Immigrants from Ethiopia (5.1%, a difference of 0.010%), Immigrants from Croatia (5.1%, a difference of 0.020%), Iranian (5.1%, a difference of 0.040%), Immigrants from Europe (5.1%, a difference of 0.040%), and Immigrants from Burma/Myanmar (5.1%, a difference of 0.050%).
| Demographics | Rating | Rank | Unemployment |
| Kenyans | 88.2 /100 | #126 | Excellent 5.1% |
| Immigrants | Kenya | 88.2 /100 | #127 | Excellent 5.1% |
| Immigrants | Eastern Africa | 88.1 /100 | #128 | Excellent 5.1% |
| Immigrants | Latvia | 88.0 /100 | #129 | Excellent 5.1% |
| Iranians | 86.9 /100 | #130 | Excellent 5.1% |
| Immigrants | Croatia | 86.8 /100 | #131 | Excellent 5.1% |
| Immigrants | Ethiopia | 86.7 /100 | #132 | Excellent 5.1% |
| Immigrants | Jordan | 86.6 /100 | #133 | Excellent 5.1% |
| Immigrants | Europe | 86.3 /100 | #134 | Excellent 5.1% |
| Immigrants | Burma/Myanmar | 86.2 /100 | #135 | Excellent 5.1% |
| Immigrants | Spain | 86.2 /100 | #136 | Excellent 5.1% |
| Immigrants | Saudi Arabia | 85.6 /100 | #137 | Excellent 5.1% |
| Immigrants | Hungary | 85.6 /100 | #138 | Excellent 5.1% |
| Pakistanis | 85.3 /100 | #139 | Excellent 5.1% |
| Immigrants | Denmark | 84.3 /100 | #140 | Excellent 5.1% |