Immigrants from Albania vs American Ambulatory Disability
COMPARE
Immigrants from Albania
American
Ambulatory Disability
Ambulatory Disability Comparison
Immigrants from Albania
Americans
6.3%
AMBULATORY DISABILITY
9.6/ 100
METRIC RATING
220th/ 347
METRIC RANK
7.4%
AMBULATORY DISABILITY
0.0/ 100
METRIC RATING
323rd/ 347
METRIC RANK
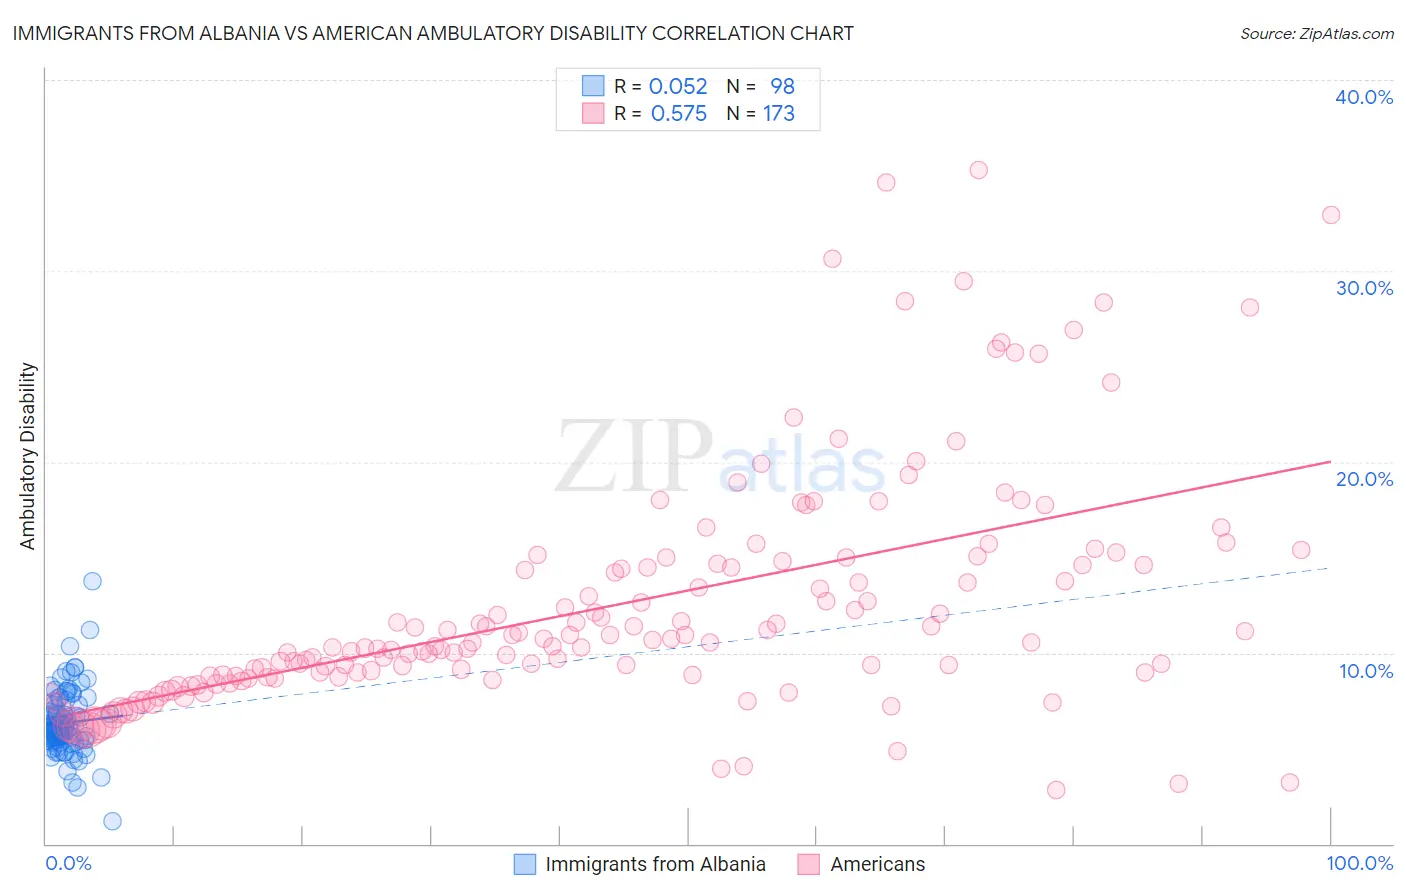
Immigrants from Albania vs American Ambulatory Disability Correlation Chart
The statistical analysis conducted on geographies consisting of 119,394,227 people shows a slight positive correlation between the proportion of Immigrants from Albania and percentage of population with ambulatory disability in the United States with a correlation coefficient (R) of 0.052 and weighted average of 6.3%. Similarly, the statistical analysis conducted on geographies consisting of 581,324,022 people shows a substantial positive correlation between the proportion of Americans and percentage of population with ambulatory disability in the United States with a correlation coefficient (R) of 0.575 and weighted average of 7.4%, a difference of 17.6%.
Ambulatory Disability Correlation Summary
| Measurement | Immigrants from Albania | American |
| Minimum | 1.2% | 2.8% |
| Maximum | 13.8% | 35.3% |
| Range | 12.6% | 32.5% |
| Mean | 6.3% | 12.5% |
| Median | 6.0% | 10.5% |
| Interquartile 25% (IQ1) | 5.5% | 8.8% |
| Interquartile 75% (IQ3) | 7.1% | 14.6% |
| Interquartile Range (IQR) | 1.6% | 5.9% |
| Standard Deviation (Sample) | 1.7% | 6.2% |
| Standard Deviation (Population) | 1.7% | 6.1% |
Similar Demographics by Ambulatory Disability
Demographics Similar to Immigrants from Albania by Ambulatory Disability
In terms of ambulatory disability, the demographic groups most similar to Immigrants from Albania are Hungarian (6.3%, a difference of 0.010%), German Russian (6.3%, a difference of 0.030%), Indonesian (6.3%, a difference of 0.040%), Guamanian/Chamorro (6.3%, a difference of 0.13%), and Canadian (6.3%, a difference of 0.18%).
| Demographics | Rating | Rank | Ambulatory Disability |
| Japanese | 12.0 /100 | #213 | Poor 6.3% |
| Immigrants | Mexico | 11.0 /100 | #214 | Poor 6.3% |
| Immigrants | Latin America | 11.0 /100 | #215 | Poor 6.3% |
| Canadians | 10.9 /100 | #216 | Poor 6.3% |
| Yugoslavians | 10.9 /100 | #217 | Poor 6.3% |
| Guamanians/Chamorros | 10.6 /100 | #218 | Poor 6.3% |
| Indonesians | 9.9 /100 | #219 | Tragic 6.3% |
| Immigrants | Albania | 9.6 /100 | #220 | Tragic 6.3% |
| Hungarians | 9.6 /100 | #221 | Tragic 6.3% |
| German Russians | 9.4 /100 | #222 | Tragic 6.3% |
| Immigrants | Honduras | 7.6 /100 | #223 | Tragic 6.3% |
| Liberians | 7.1 /100 | #224 | Tragic 6.3% |
| Hondurans | 6.3 /100 | #225 | Tragic 6.3% |
| Slavs | 5.1 /100 | #226 | Tragic 6.4% |
| Cubans | 4.0 /100 | #227 | Tragic 6.4% |
Demographics Similar to Americans by Ambulatory Disability
In terms of ambulatory disability, the demographic groups most similar to Americans are Osage (7.4%, a difference of 0.28%), Apache (7.4%, a difference of 0.42%), Potawatomi (7.3%, a difference of 1.2%), Navajo (7.5%, a difference of 1.3%), and Comanche (7.5%, a difference of 1.4%).
| Demographics | Rating | Rank | Ambulatory Disability |
| Immigrants | Dominican Republic | 0.0 /100 | #316 | Tragic 7.1% |
| Central American Indians | 0.0 /100 | #317 | Tragic 7.2% |
| Ottawa | 0.0 /100 | #318 | Tragic 7.2% |
| Dominicans | 0.0 /100 | #319 | Tragic 7.2% |
| Potawatomi | 0.0 /100 | #320 | Tragic 7.3% |
| Apache | 0.0 /100 | #321 | Tragic 7.4% |
| Osage | 0.0 /100 | #322 | Tragic 7.4% |
| Americans | 0.0 /100 | #323 | Tragic 7.4% |
| Navajo | 0.0 /100 | #324 | Tragic 7.5% |
| Comanche | 0.0 /100 | #325 | Tragic 7.5% |
| Blacks/African Americans | 0.0 /100 | #326 | Tragic 7.5% |
| Natives/Alaskans | 0.0 /100 | #327 | Tragic 7.5% |
| Hopi | 0.0 /100 | #328 | Tragic 7.6% |
| Pueblo | 0.0 /100 | #329 | Tragic 7.6% |
| Paiute | 0.0 /100 | #330 | Tragic 7.7% |