Maltese vs Immigrants from Lebanon Self-Care Disability
COMPARE
Maltese
Immigrants from Lebanon
Self-Care Disability
Self-Care Disability Comparison
Maltese
Immigrants from Lebanon
2.5%
SELF-CARE DISABILITY
37.5/ 100
METRIC RATING
182nd/ 347
METRIC RANK
2.5%
SELF-CARE DISABILITY
12.4/ 100
METRIC RATING
203rd/ 347
METRIC RANK
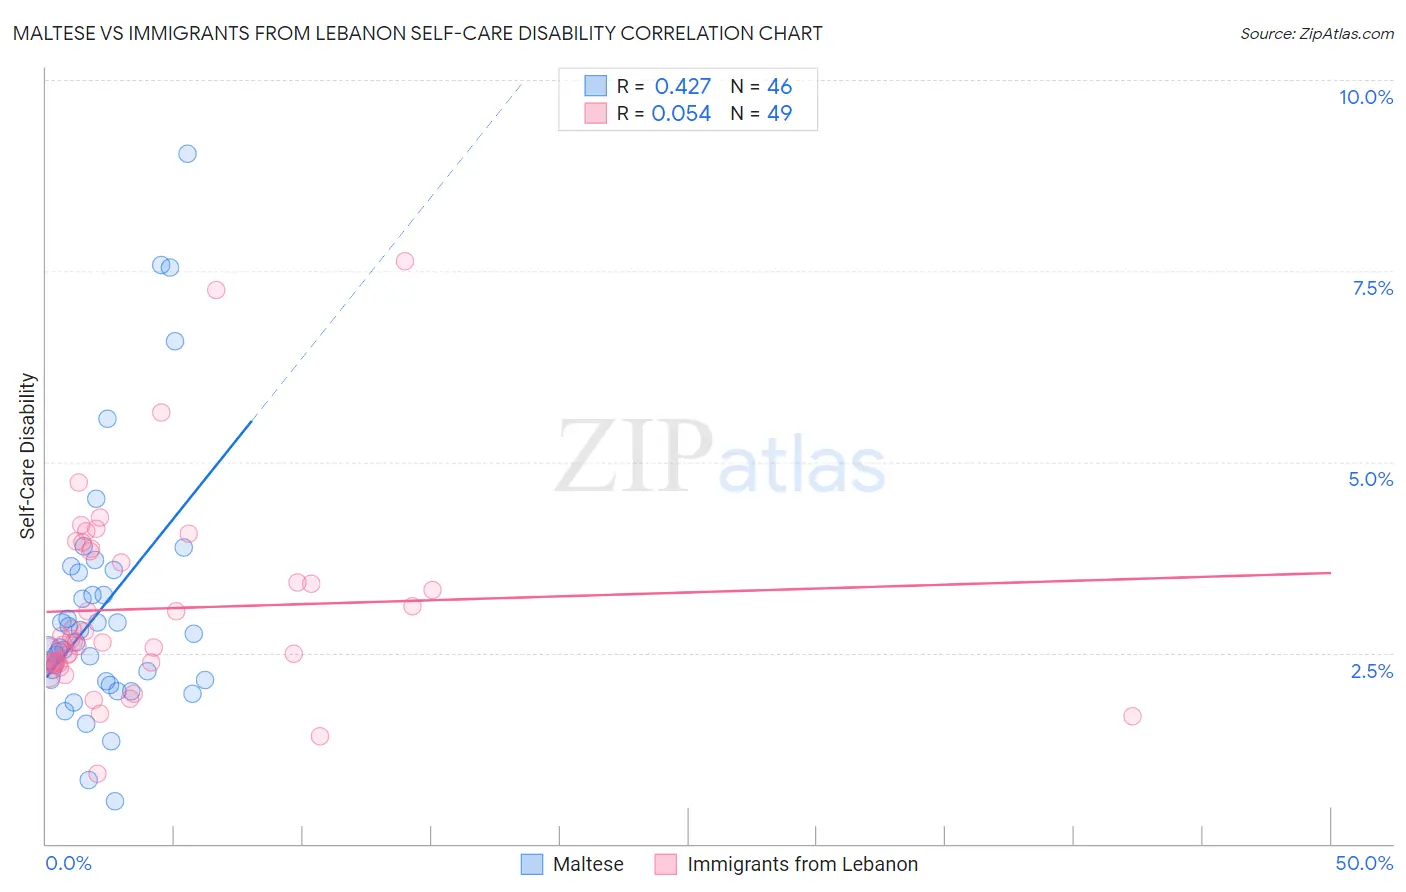
Maltese vs Immigrants from Lebanon Self-Care Disability Correlation Chart
The statistical analysis conducted on geographies consisting of 126,446,361 people shows a moderate positive correlation between the proportion of Maltese and percentage of population with self-care disability in the United States with a correlation coefficient (R) of 0.427 and weighted average of 2.5%. Similarly, the statistical analysis conducted on geographies consisting of 217,055,251 people shows a slight positive correlation between the proportion of Immigrants from Lebanon and percentage of population with self-care disability in the United States with a correlation coefficient (R) of 0.054 and weighted average of 2.5%, a difference of 1.7%.
Self-Care Disability Correlation Summary
| Measurement | Maltese | Immigrants from Lebanon |
| Minimum | 0.56% | 0.92% |
| Maximum | 9.0% | 7.6% |
| Range | 8.5% | 6.7% |
| Mean | 3.1% | 3.1% |
| Median | 2.6% | 2.6% |
| Interquartile 25% (IQ1) | 2.1% | 2.4% |
| Interquartile 75% (IQ3) | 3.5% | 3.8% |
| Interquartile Range (IQR) | 1.4% | 1.5% |
| Standard Deviation (Sample) | 1.7% | 1.3% |
| Standard Deviation (Population) | 1.7% | 1.3% |
Similar Demographics by Self-Care Disability
Demographics Similar to Maltese by Self-Care Disability
In terms of self-care disability, the demographic groups most similar to Maltese are Salvadoran (2.5%, a difference of 0.050%), Yugoslavian (2.5%, a difference of 0.070%), Ghanaian (2.5%, a difference of 0.14%), Slavic (2.5%, a difference of 0.16%), and Indonesian (2.5%, a difference of 0.19%).
| Demographics | Rating | Rank | Self-Care Disability |
| Immigrants | Bosnia and Herzegovina | 49.6 /100 | #175 | Average 2.5% |
| Immigrants | Afghanistan | 47.6 /100 | #176 | Average 2.5% |
| Immigrants | Kazakhstan | 46.7 /100 | #177 | Average 2.5% |
| English | 46.2 /100 | #178 | Average 2.5% |
| Hungarians | 45.5 /100 | #179 | Average 2.5% |
| Indonesians | 41.2 /100 | #180 | Average 2.5% |
| Ghanaians | 40.4 /100 | #181 | Average 2.5% |
| Maltese | 37.5 /100 | #182 | Fair 2.5% |
| Salvadorans | 36.4 /100 | #183 | Fair 2.5% |
| Yugoslavians | 36.1 /100 | #184 | Fair 2.5% |
| Slavs | 34.3 /100 | #185 | Fair 2.5% |
| Immigrants | El Salvador | 33.0 /100 | #186 | Fair 2.5% |
| Irish | 28.7 /100 | #187 | Fair 2.5% |
| Immigrants | Oceania | 28.3 /100 | #188 | Fair 2.5% |
| Immigrants | Eastern Europe | 28.0 /100 | #189 | Fair 2.5% |
Demographics Similar to Immigrants from Lebanon by Self-Care Disability
In terms of self-care disability, the demographic groups most similar to Immigrants from Lebanon are Slovak (2.5%, a difference of 0.020%), Immigrants from South Eastern Asia (2.5%, a difference of 0.050%), Immigrants from Bahamas (2.5%, a difference of 0.050%), Immigrants from Western Africa (2.5%, a difference of 0.090%), and Immigrants from Russia (2.5%, a difference of 0.15%).
| Demographics | Rating | Rank | Self-Care Disability |
| Koreans | 15.5 /100 | #196 | Poor 2.5% |
| Crow | 15.2 /100 | #197 | Poor 2.5% |
| Immigrants | Immigrants | 15.0 /100 | #198 | Poor 2.5% |
| Immigrants | Ghana | 14.7 /100 | #199 | Poor 2.5% |
| Immigrants | Western Africa | 13.3 /100 | #200 | Poor 2.5% |
| Immigrants | South Eastern Asia | 12.9 /100 | #201 | Poor 2.5% |
| Slovaks | 12.6 /100 | #202 | Poor 2.5% |
| Immigrants | Lebanon | 12.4 /100 | #203 | Poor 2.5% |
| Immigrants | Bahamas | 11.9 /100 | #204 | Poor 2.5% |
| Immigrants | Russia | 11.0 /100 | #205 | Poor 2.5% |
| Alaskan Athabascans | 10.4 /100 | #206 | Poor 2.5% |
| French | 9.9 /100 | #207 | Tragic 2.5% |
| Central Americans | 8.7 /100 | #208 | Tragic 2.5% |
| Malaysians | 7.7 /100 | #209 | Tragic 2.5% |
| Panamanians | 6.4 /100 | #210 | Tragic 2.5% |