Sioux vs Immigrants from Hong Kong Female Disability
COMPARE
Sioux
Immigrants from Hong Kong
Female Disability
Female Disability Comparison
Sioux
Immigrants from Hong Kong
12.9%
FEMALE DISABILITY
0.1/ 100
METRIC RATING
273rd/ 347
METRIC RANK
10.6%
FEMALE DISABILITY
100.0/ 100
METRIC RATING
10th/ 347
METRIC RANK
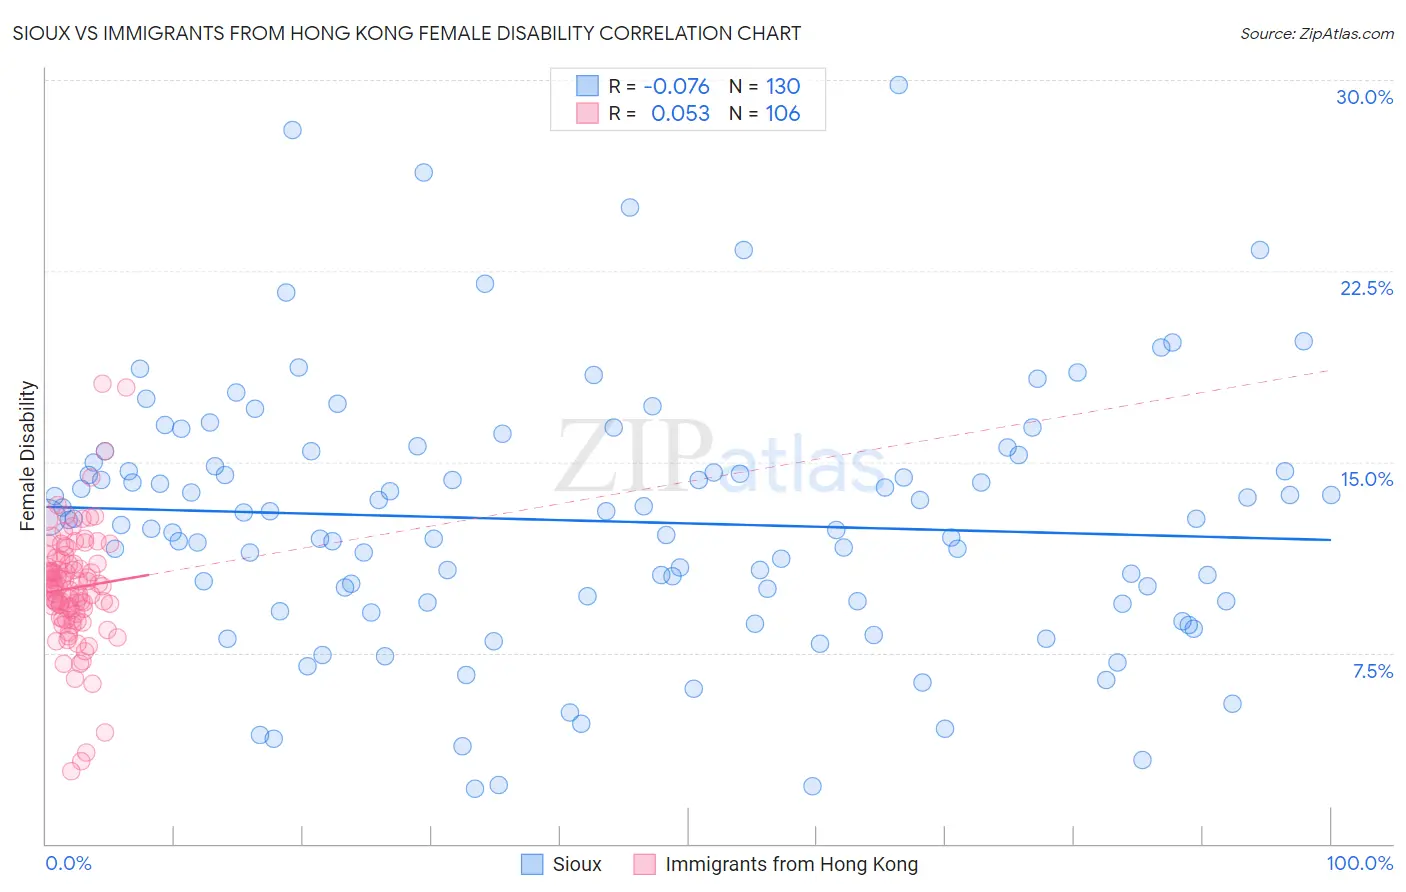
Sioux vs Immigrants from Hong Kong Female Disability Correlation Chart
The statistical analysis conducted on geographies consisting of 234,143,610 people shows a slight negative correlation between the proportion of Sioux and percentage of females with a disability in the United States with a correlation coefficient (R) of -0.076 and weighted average of 12.9%. Similarly, the statistical analysis conducted on geographies consisting of 253,994,726 people shows a slight positive correlation between the proportion of Immigrants from Hong Kong and percentage of females with a disability in the United States with a correlation coefficient (R) of 0.053 and weighted average of 10.6%, a difference of 21.9%.
Female Disability Correlation Summary
| Measurement | Sioux | Immigrants from Hong Kong |
| Minimum | 2.2% | 2.9% |
| Maximum | 29.8% | 18.1% |
| Range | 27.6% | 15.2% |
| Mean | 12.7% | 10.0% |
| Median | 12.7% | 10.1% |
| Interquartile 25% (IQ1) | 9.5% | 9.0% |
| Interquartile 75% (IQ3) | 15.0% | 11.0% |
| Interquartile Range (IQR) | 5.5% | 2.0% |
| Standard Deviation (Sample) | 5.1% | 2.3% |
| Standard Deviation (Population) | 5.1% | 2.3% |
Similar Demographics by Female Disability
Demographics Similar to Sioux by Female Disability
In terms of female disability, the demographic groups most similar to Sioux are German (12.9%, a difference of 0.020%), Portuguese (13.0%, a difference of 0.12%), Cheyenne (13.0%, a difference of 0.17%), Immigrants from Dominica (13.0%, a difference of 0.22%), and Dutch (12.9%, a difference of 0.23%).
| Demographics | Rating | Rank | Female Disability |
| Finns | 0.4 /100 | #266 | Tragic 12.8% |
| Senegalese | 0.4 /100 | #267 | Tragic 12.8% |
| Immigrants | Laos | 0.4 /100 | #268 | Tragic 12.8% |
| Indonesians | 0.4 /100 | #269 | Tragic 12.8% |
| Immigrants | Liberia | 0.3 /100 | #270 | Tragic 12.9% |
| Dutch | 0.2 /100 | #271 | Tragic 12.9% |
| Germans | 0.1 /100 | #272 | Tragic 12.9% |
| Sioux | 0.1 /100 | #273 | Tragic 12.9% |
| Portuguese | 0.1 /100 | #274 | Tragic 13.0% |
| Cheyenne | 0.1 /100 | #275 | Tragic 13.0% |
| Immigrants | Dominica | 0.1 /100 | #276 | Tragic 13.0% |
| Spanish | 0.1 /100 | #277 | Tragic 13.0% |
| Scottish | 0.1 /100 | #278 | Tragic 13.0% |
| Arapaho | 0.1 /100 | #279 | Tragic 13.0% |
| Irish | 0.1 /100 | #280 | Tragic 13.1% |
Demographics Similar to Immigrants from Hong Kong by Female Disability
In terms of female disability, the demographic groups most similar to Immigrants from Hong Kong are Immigrants from Korea (10.6%, a difference of 0.17%), Immigrants from Israel (10.7%, a difference of 0.59%), Iranian (10.6%, a difference of 0.65%), Immigrants from Eastern Asia (10.7%, a difference of 0.66%), and Immigrants from China (10.7%, a difference of 0.69%).
| Demographics | Rating | Rank | Female Disability |
| Immigrants | Taiwan | 100.0 /100 | #3 | Exceptional 10.1% |
| Thais | 100.0 /100 | #4 | Exceptional 10.2% |
| Immigrants | Bolivia | 100.0 /100 | #5 | Exceptional 10.3% |
| Bolivians | 100.0 /100 | #6 | Exceptional 10.4% |
| Immigrants | Singapore | 100.0 /100 | #7 | Exceptional 10.4% |
| Immigrants | South Central Asia | 100.0 /100 | #8 | Exceptional 10.5% |
| Iranians | 100.0 /100 | #9 | Exceptional 10.6% |
| Immigrants | Hong Kong | 100.0 /100 | #10 | Exceptional 10.6% |
| Immigrants | Korea | 100.0 /100 | #11 | Exceptional 10.6% |
| Immigrants | Israel | 100.0 /100 | #12 | Exceptional 10.7% |
| Immigrants | Eastern Asia | 100.0 /100 | #13 | Exceptional 10.7% |
| Immigrants | China | 100.0 /100 | #14 | Exceptional 10.7% |
| Burmese | 100.0 /100 | #15 | Exceptional 10.7% |
| Okinawans | 100.0 /100 | #16 | Exceptional 10.8% |
| Indians (Asian) | 100.0 /100 | #17 | Exceptional 10.8% |