Latvian vs Immigrants from Hong Kong Female Disability
COMPARE
Latvian
Immigrants from Hong Kong
Female Disability
Female Disability Comparison
Latvians
Immigrants from Hong Kong
11.7%
FEMALE DISABILITY
98.2/ 100
METRIC RATING
107th/ 347
METRIC RANK
10.6%
FEMALE DISABILITY
100.0/ 100
METRIC RATING
10th/ 347
METRIC RANK
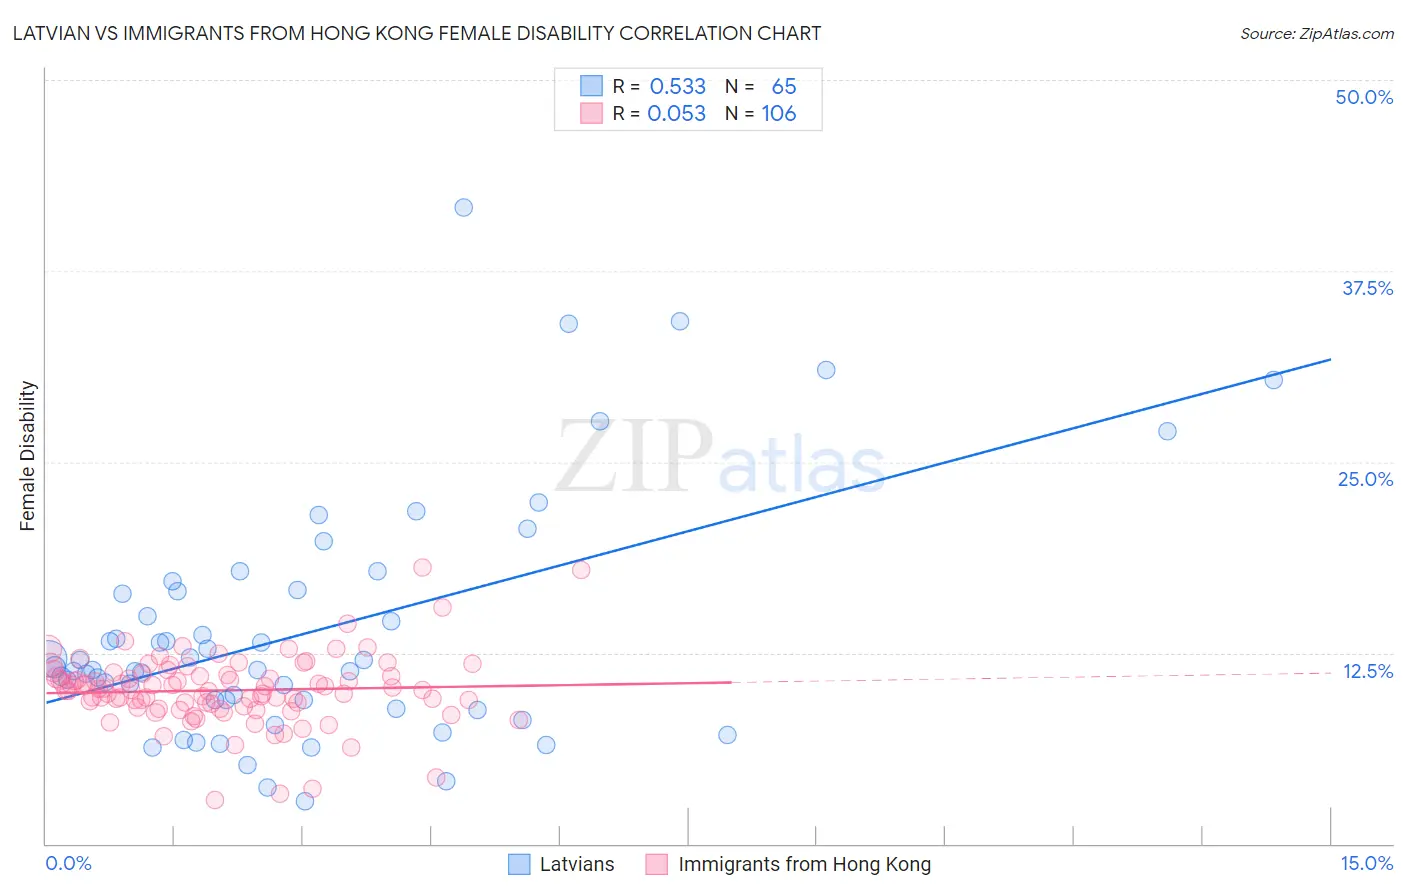
Latvian vs Immigrants from Hong Kong Female Disability Correlation Chart
The statistical analysis conducted on geographies consisting of 220,713,826 people shows a substantial positive correlation between the proportion of Latvians and percentage of females with a disability in the United States with a correlation coefficient (R) of 0.533 and weighted average of 11.7%. Similarly, the statistical analysis conducted on geographies consisting of 253,994,726 people shows a slight positive correlation between the proportion of Immigrants from Hong Kong and percentage of females with a disability in the United States with a correlation coefficient (R) of 0.053 and weighted average of 10.6%, a difference of 10.5%.
Female Disability Correlation Summary
| Measurement | Latvian | Immigrants from Hong Kong |
| Minimum | 2.8% | 2.9% |
| Maximum | 41.7% | 18.1% |
| Range | 38.8% | 15.2% |
| Mean | 13.9% | 10.0% |
| Median | 11.4% | 10.1% |
| Interquartile 25% (IQ1) | 9.1% | 9.0% |
| Interquartile 75% (IQ3) | 16.6% | 11.0% |
| Interquartile Range (IQR) | 7.5% | 2.0% |
| Standard Deviation (Sample) | 7.9% | 2.3% |
| Standard Deviation (Population) | 7.8% | 2.3% |
Similar Demographics by Female Disability
Demographics Similar to Latvians by Female Disability
In terms of female disability, the demographic groups most similar to Latvians are Immigrants from Greece (11.7%, a difference of 0.020%), New Zealander (11.7%, a difference of 0.020%), Australian (11.7%, a difference of 0.050%), Immigrants (11.7%, a difference of 0.050%), and Soviet Union (11.7%, a difference of 0.050%).
| Demographics | Rating | Rank | Female Disability |
| Immigrants | Uruguay | 98.5 /100 | #100 | Exceptional 11.7% |
| Immigrants | Costa Rica | 98.4 /100 | #101 | Exceptional 11.7% |
| Immigrants | South Eastern Asia | 98.4 /100 | #102 | Exceptional 11.7% |
| Immigrants | Eastern Africa | 98.3 /100 | #103 | Exceptional 11.7% |
| Immigrants | Western Asia | 98.3 /100 | #104 | Exceptional 11.7% |
| Australians | 98.3 /100 | #105 | Exceptional 11.7% |
| Immigrants | Greece | 98.2 /100 | #106 | Exceptional 11.7% |
| Latvians | 98.2 /100 | #107 | Exceptional 11.7% |
| New Zealanders | 98.1 /100 | #108 | Exceptional 11.7% |
| Immigrants | Immigrants | 98.1 /100 | #109 | Exceptional 11.7% |
| Soviet Union | 98.1 /100 | #110 | Exceptional 11.7% |
| Costa Ricans | 98.1 /100 | #111 | Exceptional 11.7% |
| Immigrants | Bangladesh | 97.8 /100 | #112 | Exceptional 11.8% |
| Immigrants | Belarus | 97.8 /100 | #113 | Exceptional 11.8% |
| South Africans | 97.7 /100 | #114 | Exceptional 11.8% |
Demographics Similar to Immigrants from Hong Kong by Female Disability
In terms of female disability, the demographic groups most similar to Immigrants from Hong Kong are Immigrants from Korea (10.6%, a difference of 0.17%), Immigrants from Israel (10.7%, a difference of 0.59%), Iranian (10.6%, a difference of 0.65%), Immigrants from Eastern Asia (10.7%, a difference of 0.66%), and Immigrants from China (10.7%, a difference of 0.69%).
| Demographics | Rating | Rank | Female Disability |
| Immigrants | Taiwan | 100.0 /100 | #3 | Exceptional 10.1% |
| Thais | 100.0 /100 | #4 | Exceptional 10.2% |
| Immigrants | Bolivia | 100.0 /100 | #5 | Exceptional 10.3% |
| Bolivians | 100.0 /100 | #6 | Exceptional 10.4% |
| Immigrants | Singapore | 100.0 /100 | #7 | Exceptional 10.4% |
| Immigrants | South Central Asia | 100.0 /100 | #8 | Exceptional 10.5% |
| Iranians | 100.0 /100 | #9 | Exceptional 10.6% |
| Immigrants | Hong Kong | 100.0 /100 | #10 | Exceptional 10.6% |
| Immigrants | Korea | 100.0 /100 | #11 | Exceptional 10.6% |
| Immigrants | Israel | 100.0 /100 | #12 | Exceptional 10.7% |
| Immigrants | Eastern Asia | 100.0 /100 | #13 | Exceptional 10.7% |
| Immigrants | China | 100.0 /100 | #14 | Exceptional 10.7% |
| Burmese | 100.0 /100 | #15 | Exceptional 10.7% |
| Okinawans | 100.0 /100 | #16 | Exceptional 10.8% |
| Indians (Asian) | 100.0 /100 | #17 | Exceptional 10.8% |