Immigrants from Jamaica vs Immigrants from Hong Kong Female Disability
COMPARE
Immigrants from Jamaica
Immigrants from Hong Kong
Female Disability
Female Disability Comparison
Immigrants from Jamaica
Immigrants from Hong Kong
12.6%
FEMALE DISABILITY
2.2/ 100
METRIC RATING
245th/ 347
METRIC RANK
10.6%
FEMALE DISABILITY
100.0/ 100
METRIC RATING
10th/ 347
METRIC RANK
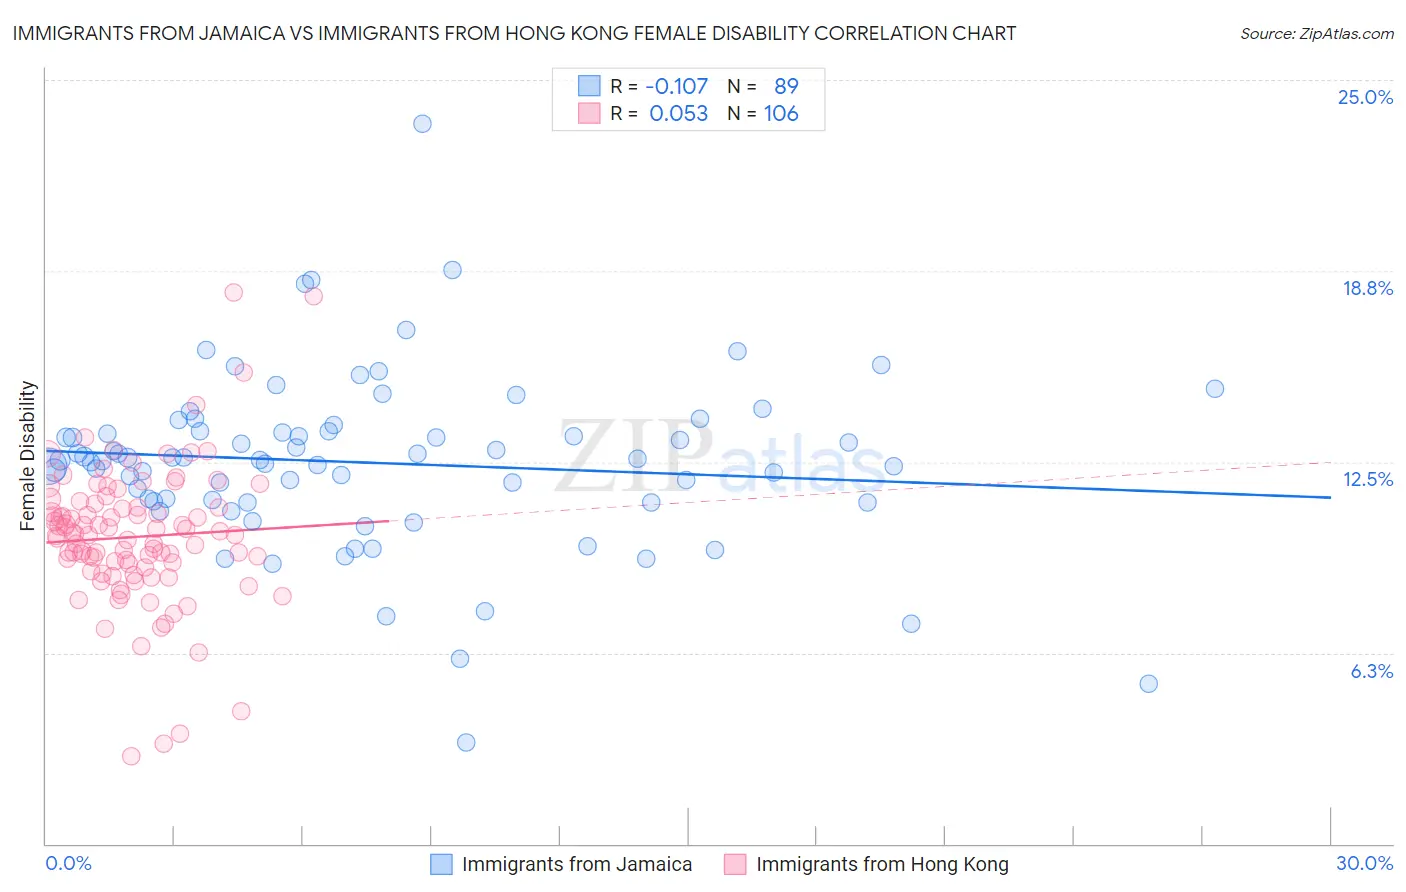
Immigrants from Jamaica vs Immigrants from Hong Kong Female Disability Correlation Chart
The statistical analysis conducted on geographies consisting of 301,727,948 people shows a poor negative correlation between the proportion of Immigrants from Jamaica and percentage of females with a disability in the United States with a correlation coefficient (R) of -0.107 and weighted average of 12.6%. Similarly, the statistical analysis conducted on geographies consisting of 253,994,726 people shows a slight positive correlation between the proportion of Immigrants from Hong Kong and percentage of females with a disability in the United States with a correlation coefficient (R) of 0.053 and weighted average of 10.6%, a difference of 19.0%.
Female Disability Correlation Summary
| Measurement | Immigrants from Jamaica | Immigrants from Hong Kong |
| Minimum | 3.3% | 2.9% |
| Maximum | 23.6% | 18.1% |
| Range | 20.2% | 15.2% |
| Mean | 12.5% | 10.0% |
| Median | 12.6% | 10.1% |
| Interquartile 25% (IQ1) | 11.2% | 9.0% |
| Interquartile 75% (IQ3) | 13.5% | 11.0% |
| Interquartile Range (IQR) | 2.3% | 2.0% |
| Standard Deviation (Sample) | 2.9% | 2.3% |
| Standard Deviation (Population) | 2.8% | 2.3% |
Similar Demographics by Female Disability
Demographics Similar to Immigrants from Jamaica by Female Disability
In terms of female disability, the demographic groups most similar to Immigrants from Jamaica are Spanish American Indian (12.6%, a difference of 0.020%), Menominee (12.6%, a difference of 0.030%), Carpatho Rusyn (12.6%, a difference of 0.070%), Alsatian (12.6%, a difference of 0.14%), and Immigrants from Senegal (12.6%, a difference of 0.15%).
| Demographics | Rating | Rank | Female Disability |
| Yugoslavians | 3.7 /100 | #238 | Tragic 12.6% |
| Barbadians | 3.6 /100 | #239 | Tragic 12.6% |
| German Russians | 3.2 /100 | #240 | Tragic 12.6% |
| Japanese | 2.7 /100 | #241 | Tragic 12.6% |
| Canadians | 2.6 /100 | #242 | Tragic 12.6% |
| Immigrants | Senegal | 2.5 /100 | #243 | Tragic 12.6% |
| Alsatians | 2.5 /100 | #244 | Tragic 12.6% |
| Immigrants | Jamaica | 2.2 /100 | #245 | Tragic 12.6% |
| Spanish American Indians | 2.1 /100 | #246 | Tragic 12.6% |
| Menominee | 2.1 /100 | #247 | Tragic 12.6% |
| Carpatho Rusyns | 2.0 /100 | #248 | Tragic 12.6% |
| Immigrants | Congo | 1.8 /100 | #249 | Tragic 12.7% |
| Slovenes | 1.7 /100 | #250 | Tragic 12.7% |
| Crow | 1.6 /100 | #251 | Tragic 12.7% |
| Immigrants | Caribbean | 1.4 /100 | #252 | Tragic 12.7% |
Demographics Similar to Immigrants from Hong Kong by Female Disability
In terms of female disability, the demographic groups most similar to Immigrants from Hong Kong are Immigrants from Korea (10.6%, a difference of 0.17%), Immigrants from Israel (10.7%, a difference of 0.59%), Iranian (10.6%, a difference of 0.65%), Immigrants from Eastern Asia (10.7%, a difference of 0.66%), and Immigrants from China (10.7%, a difference of 0.69%).
| Demographics | Rating | Rank | Female Disability |
| Immigrants | Taiwan | 100.0 /100 | #3 | Exceptional 10.1% |
| Thais | 100.0 /100 | #4 | Exceptional 10.2% |
| Immigrants | Bolivia | 100.0 /100 | #5 | Exceptional 10.3% |
| Bolivians | 100.0 /100 | #6 | Exceptional 10.4% |
| Immigrants | Singapore | 100.0 /100 | #7 | Exceptional 10.4% |
| Immigrants | South Central Asia | 100.0 /100 | #8 | Exceptional 10.5% |
| Iranians | 100.0 /100 | #9 | Exceptional 10.6% |
| Immigrants | Hong Kong | 100.0 /100 | #10 | Exceptional 10.6% |
| Immigrants | Korea | 100.0 /100 | #11 | Exceptional 10.6% |
| Immigrants | Israel | 100.0 /100 | #12 | Exceptional 10.7% |
| Immigrants | Eastern Asia | 100.0 /100 | #13 | Exceptional 10.7% |
| Immigrants | China | 100.0 /100 | #14 | Exceptional 10.7% |
| Burmese | 100.0 /100 | #15 | Exceptional 10.7% |
| Okinawans | 100.0 /100 | #16 | Exceptional 10.8% |
| Indians (Asian) | 100.0 /100 | #17 | Exceptional 10.8% |