Ukrainian vs Immigrants from Ecuador Female Disability
COMPARE
Ukrainian
Immigrants from Ecuador
Female Disability
Female Disability Comparison
Ukrainians
Immigrants from Ecuador
12.3%
FEMALE DISABILITY
27.2/ 100
METRIC RATING
194th/ 347
METRIC RANK
11.9%
FEMALE DISABILITY
91.5/ 100
METRIC RATING
141st/ 347
METRIC RANK
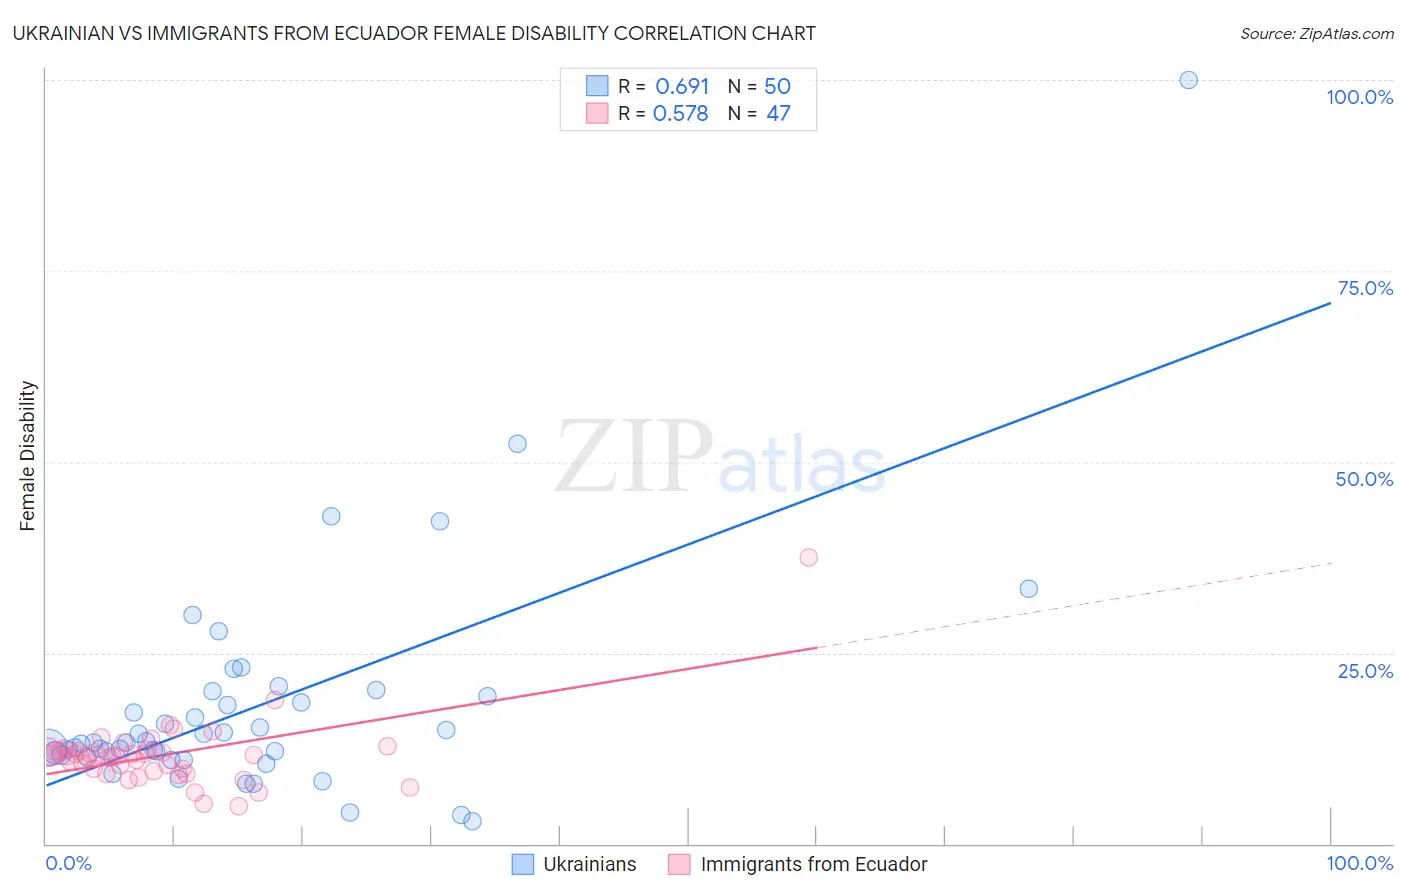
Ukrainian vs Immigrants from Ecuador Female Disability Correlation Chart
The statistical analysis conducted on geographies consisting of 448,602,757 people shows a significant positive correlation between the proportion of Ukrainians and percentage of females with a disability in the United States with a correlation coefficient (R) of 0.691 and weighted average of 12.3%. Similarly, the statistical analysis conducted on geographies consisting of 270,971,790 people shows a substantial positive correlation between the proportion of Immigrants from Ecuador and percentage of females with a disability in the United States with a correlation coefficient (R) of 0.578 and weighted average of 11.9%, a difference of 3.2%.
Female Disability Correlation Summary
| Measurement | Ukrainian | Immigrants from Ecuador |
| Minimum | 2.9% | 4.9% |
| Maximum | 100.0% | 37.5% |
| Range | 97.1% | 32.6% |
| Mean | 18.0% | 11.6% |
| Median | 13.3% | 11.5% |
| Interquartile 25% (IQ1) | 11.6% | 9.5% |
| Interquartile 75% (IQ3) | 19.4% | 12.2% |
| Interquartile Range (IQR) | 7.7% | 2.6% |
| Standard Deviation (Sample) | 15.3% | 4.6% |
| Standard Deviation (Population) | 15.1% | 4.6% |
Similar Demographics by Female Disability
Demographics Similar to Ukrainians by Female Disability
In terms of female disability, the demographic groups most similar to Ukrainians are Northern European (12.3%, a difference of 0.010%), Swedish (12.3%, a difference of 0.030%), Immigrants from Panama (12.3%, a difference of 0.080%), Honduran (12.3%, a difference of 0.080%), and Immigrants from Western Africa (12.3%, a difference of 0.090%).
| Demographics | Rating | Rank | Female Disability |
| Serbians | 33.1 /100 | #187 | Fair 12.3% |
| Immigrants | North America | 32.8 /100 | #188 | Fair 12.3% |
| Immigrants | Albania | 31.6 /100 | #189 | Fair 12.3% |
| Immigrants | Honduras | 31.3 /100 | #190 | Fair 12.3% |
| Armenians | 29.7 /100 | #191 | Fair 12.3% |
| Immigrants | Western Africa | 29.2 /100 | #192 | Fair 12.3% |
| Northern Europeans | 27.5 /100 | #193 | Fair 12.3% |
| Ukrainians | 27.2 /100 | #194 | Fair 12.3% |
| Swedes | 26.6 /100 | #195 | Fair 12.3% |
| Immigrants | Panama | 25.5 /100 | #196 | Fair 12.3% |
| Hondurans | 25.4 /100 | #197 | Fair 12.3% |
| Mexican American Indians | 24.9 /100 | #198 | Fair 12.3% |
| Immigrants | Trinidad and Tobago | 24.7 /100 | #199 | Fair 12.3% |
| Trinidadians and Tobagonians | 22.4 /100 | #200 | Fair 12.3% |
| Chinese | 22.1 /100 | #201 | Fair 12.3% |
Demographics Similar to Immigrants from Ecuador by Female Disability
In terms of female disability, the demographic groups most similar to Immigrants from Ecuador are Romanian (11.9%, a difference of 0.020%), Immigrants from Africa (11.9%, a difference of 0.17%), Immigrants from Hungary (11.9%, a difference of 0.18%), Immigrants from Sudan (11.9%, a difference of 0.21%), and Ecuadorian (11.9%, a difference of 0.26%).
| Demographics | Rating | Rank | Female Disability |
| Immigrants | Nicaragua | 94.5 /100 | #134 | Exceptional 11.9% |
| Central Americans | 94.2 /100 | #135 | Exceptional 11.9% |
| Ugandans | 94.0 /100 | #136 | Exceptional 11.9% |
| Immigrants | Norway | 93.8 /100 | #137 | Exceptional 11.9% |
| Ecuadorians | 93.4 /100 | #138 | Exceptional 11.9% |
| Immigrants | Hungary | 92.8 /100 | #139 | Exceptional 11.9% |
| Romanians | 91.6 /100 | #140 | Exceptional 11.9% |
| Immigrants | Ecuador | 91.5 /100 | #141 | Exceptional 11.9% |
| Immigrants | Africa | 90.0 /100 | #142 | Excellent 11.9% |
| Immigrants | Sudan | 89.6 /100 | #143 | Excellent 11.9% |
| Immigrants | Austria | 87.9 /100 | #144 | Excellent 12.0% |
| Estonians | 87.8 /100 | #145 | Excellent 12.0% |
| Pakistanis | 84.6 /100 | #146 | Excellent 12.0% |
| Nigerians | 84.0 /100 | #147 | Excellent 12.0% |
| Immigrants | Kenya | 83.1 /100 | #148 | Excellent 12.0% |