Tongan vs Immigrants from Ecuador Female Disability
COMPARE
Tongan
Immigrants from Ecuador
Female Disability
Female Disability Comparison
Tongans
Immigrants from Ecuador
11.3%
FEMALE DISABILITY
100.0/ 100
METRIC RATING
49th/ 347
METRIC RANK
11.9%
FEMALE DISABILITY
91.5/ 100
METRIC RATING
141st/ 347
METRIC RANK
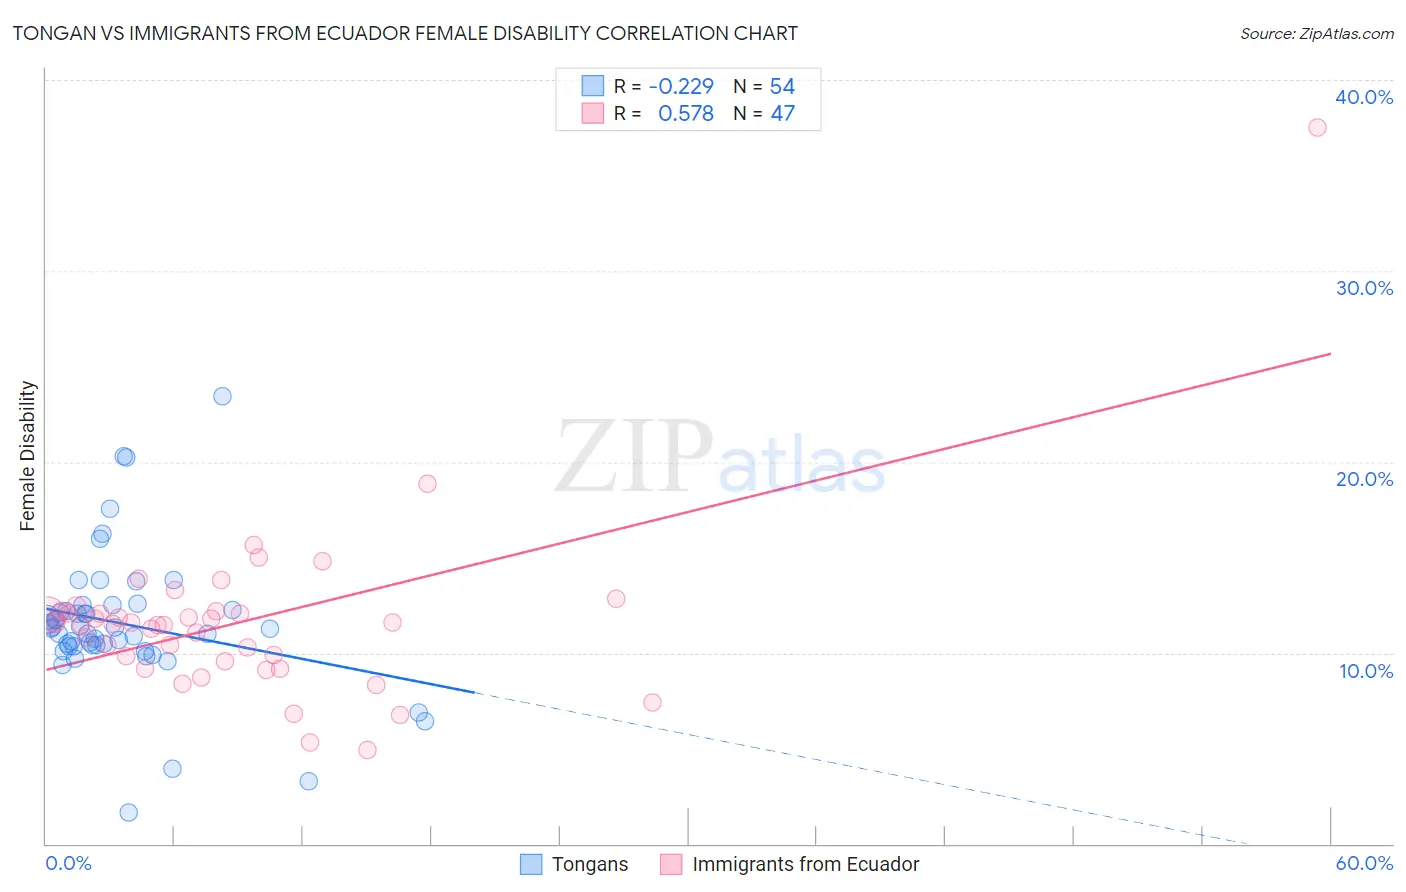
Tongan vs Immigrants from Ecuador Female Disability Correlation Chart
The statistical analysis conducted on geographies consisting of 102,892,967 people shows a weak negative correlation between the proportion of Tongans and percentage of females with a disability in the United States with a correlation coefficient (R) of -0.229 and weighted average of 11.3%. Similarly, the statistical analysis conducted on geographies consisting of 270,971,790 people shows a substantial positive correlation between the proportion of Immigrants from Ecuador and percentage of females with a disability in the United States with a correlation coefficient (R) of 0.578 and weighted average of 11.9%, a difference of 5.8%.
Female Disability Correlation Summary
| Measurement | Tongan | Immigrants from Ecuador |
| Minimum | 1.6% | 4.9% |
| Maximum | 23.4% | 37.5% |
| Range | 21.8% | 32.6% |
| Mean | 11.5% | 11.6% |
| Median | 11.3% | 11.5% |
| Interquartile 25% (IQ1) | 10.3% | 9.5% |
| Interquartile 75% (IQ3) | 12.3% | 12.2% |
| Interquartile Range (IQR) | 1.9% | 2.6% |
| Standard Deviation (Sample) | 3.6% | 4.6% |
| Standard Deviation (Population) | 3.6% | 4.6% |
Similar Demographics by Female Disability
Demographics Similar to Tongans by Female Disability
In terms of female disability, the demographic groups most similar to Tongans are Jordanian (11.3%, a difference of 0.010%), Zimbabwean (11.3%, a difference of 0.010%), Immigrants from Nepal (11.3%, a difference of 0.030%), Immigrants from Sweden (11.3%, a difference of 0.080%), and Cambodian (11.3%, a difference of 0.12%).
| Demographics | Rating | Rank | Female Disability |
| Israelis | 100.0 /100 | #42 | Exceptional 11.2% |
| Afghans | 100.0 /100 | #43 | Exceptional 11.2% |
| Cambodians | 100.0 /100 | #44 | Exceptional 11.3% |
| Immigrants | Sweden | 100.0 /100 | #45 | Exceptional 11.3% |
| Immigrants | Nepal | 100.0 /100 | #46 | Exceptional 11.3% |
| Jordanians | 100.0 /100 | #47 | Exceptional 11.3% |
| Zimbabweans | 100.0 /100 | #48 | Exceptional 11.3% |
| Tongans | 100.0 /100 | #49 | Exceptional 11.3% |
| Inupiat | 100.0 /100 | #50 | Exceptional 11.3% |
| Immigrants | Belgium | 100.0 /100 | #51 | Exceptional 11.3% |
| Immigrants | Peru | 99.9 /100 | #52 | Exceptional 11.3% |
| Immigrants | Saudi Arabia | 99.9 /100 | #53 | Exceptional 11.3% |
| Peruvians | 99.9 /100 | #54 | Exceptional 11.3% |
| Bulgarians | 99.9 /100 | #55 | Exceptional 11.3% |
| Taiwanese | 99.9 /100 | #56 | Exceptional 11.4% |
Demographics Similar to Immigrants from Ecuador by Female Disability
In terms of female disability, the demographic groups most similar to Immigrants from Ecuador are Romanian (11.9%, a difference of 0.020%), Immigrants from Africa (11.9%, a difference of 0.17%), Immigrants from Hungary (11.9%, a difference of 0.18%), Immigrants from Sudan (11.9%, a difference of 0.21%), and Ecuadorian (11.9%, a difference of 0.26%).
| Demographics | Rating | Rank | Female Disability |
| Immigrants | Nicaragua | 94.5 /100 | #134 | Exceptional 11.9% |
| Central Americans | 94.2 /100 | #135 | Exceptional 11.9% |
| Ugandans | 94.0 /100 | #136 | Exceptional 11.9% |
| Immigrants | Norway | 93.8 /100 | #137 | Exceptional 11.9% |
| Ecuadorians | 93.4 /100 | #138 | Exceptional 11.9% |
| Immigrants | Hungary | 92.8 /100 | #139 | Exceptional 11.9% |
| Romanians | 91.6 /100 | #140 | Exceptional 11.9% |
| Immigrants | Ecuador | 91.5 /100 | #141 | Exceptional 11.9% |
| Immigrants | Africa | 90.0 /100 | #142 | Excellent 11.9% |
| Immigrants | Sudan | 89.6 /100 | #143 | Excellent 11.9% |
| Immigrants | Austria | 87.9 /100 | #144 | Excellent 12.0% |
| Estonians | 87.8 /100 | #145 | Excellent 12.0% |
| Pakistanis | 84.6 /100 | #146 | Excellent 12.0% |
| Nigerians | 84.0 /100 | #147 | Excellent 12.0% |
| Immigrants | Kenya | 83.1 /100 | #148 | Excellent 12.0% |