Hopi vs Immigrants from Denmark Disability Age Under 5
COMPARE
Hopi
Immigrants from Denmark
Disability Age Under 5
Disability Age Under 5 Comparison
Hopi
Immigrants from Denmark
4.6%
DISABILITY AGE UNDER 5
0.0/ 100
METRIC RATING
347th/ 347
METRIC RANK
1.1%
DISABILITY AGE UNDER 5
98.1/ 100
METRIC RATING
77th/ 347
METRIC RANK
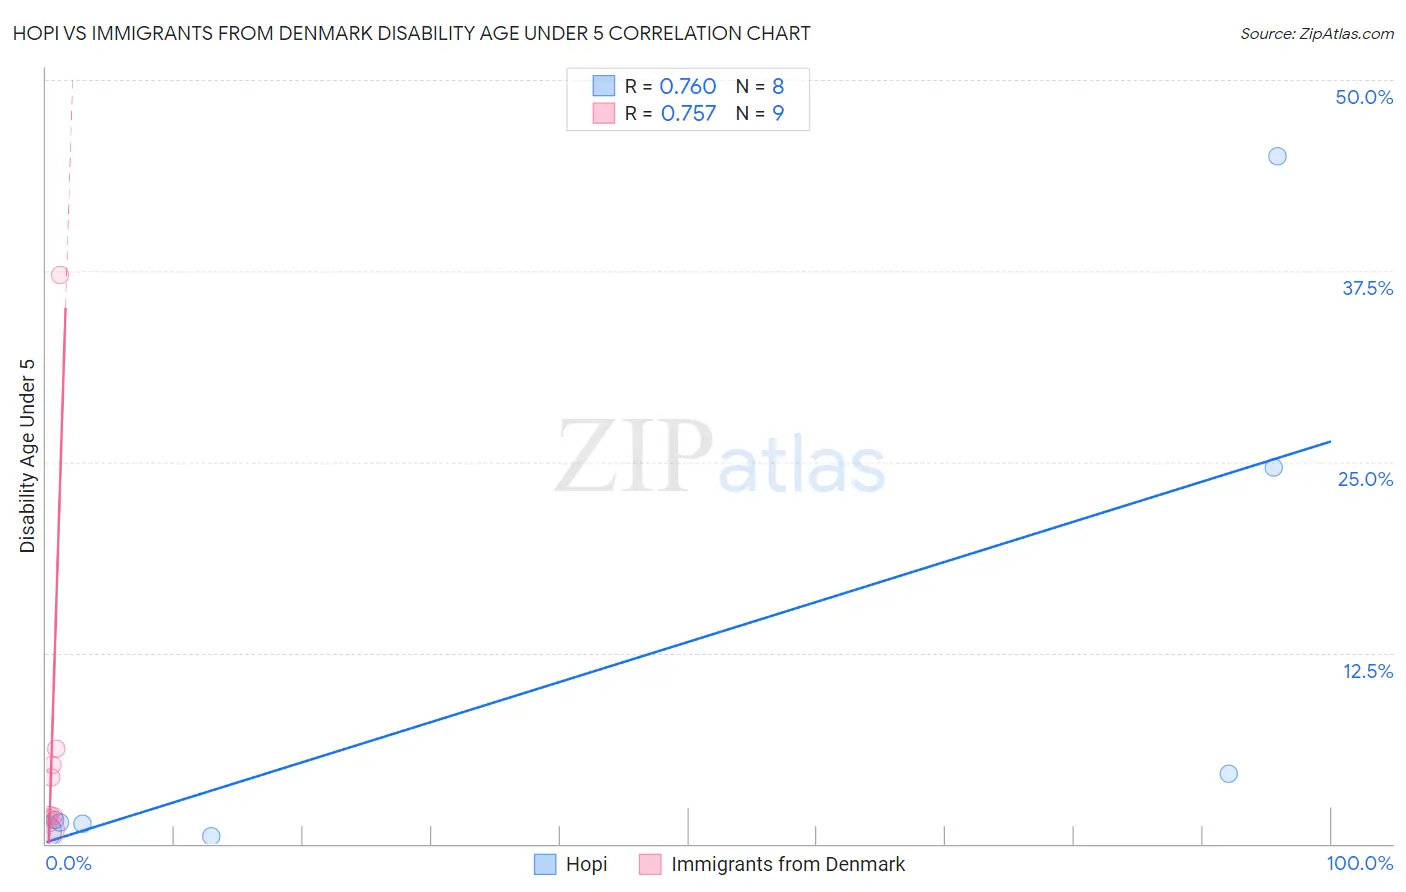
Hopi vs Immigrants from Denmark Disability Age Under 5 Correlation Chart
The statistical analysis conducted on geographies consisting of 60,809,841 people shows a strong positive correlation between the proportion of Hopi and percentage of population with a disability under the age of 5 in the United States with a correlation coefficient (R) of 0.760 and weighted average of 4.6%. Similarly, the statistical analysis conducted on geographies consisting of 97,246,779 people shows a strong positive correlation between the proportion of Immigrants from Denmark and percentage of population with a disability under the age of 5 in the United States with a correlation coefficient (R) of 0.757 and weighted average of 1.1%, a difference of 309.9%.
Disability Age Under 5 Correlation Summary
| Measurement | Hopi | Immigrants from Denmark |
| Minimum | 0.45% | 0.89% |
| Maximum | 45.0% | 37.3% |
| Range | 44.5% | 36.4% |
| Mean | 10.0% | 6.7% |
| Median | 1.5% | 1.9% |
| Interquartile 25% (IQ1) | 1.1% | 1.5% |
| Interquartile 75% (IQ3) | 14.6% | 5.7% |
| Interquartile Range (IQR) | 13.6% | 4.1% |
| Standard Deviation (Sample) | 16.3% | 11.6% |
| Standard Deviation (Population) | 15.3% | 10.9% |
Similar Demographics by Disability Age Under 5
Demographics Similar to Hopi by Disability Age Under 5
In terms of disability age under 5, the demographic groups most similar to Hopi are Yup'ik (4.5%, a difference of 2.3%), Paiute (3.9%, a difference of 18.4%), Inupiat (3.7%, a difference of 24.8%), Colville (3.3%, a difference of 41.0%), and Alaska Native (2.9%, a difference of 57.3%).
| Demographics | Rating | Rank | Disability Age Under 5 |
| Dutch West Indians | 0.0 /100 | #333 | Tragic 1.9% |
| Natives/Alaskans | 0.0 /100 | #334 | Tragic 1.9% |
| Pennsylvania Germans | 0.0 /100 | #335 | Tragic 1.9% |
| Paraguayans | 0.0 /100 | #336 | Tragic 2.0% |
| Apache | 0.0 /100 | #337 | Tragic 2.0% |
| Tohono O'odham | 0.0 /100 | #338 | Tragic 2.2% |
| Immigrants | Azores | 0.0 /100 | #339 | Tragic 2.2% |
| Menominee | 0.0 /100 | #340 | Tragic 2.3% |
| Tsimshian | 0.0 /100 | #341 | Tragic 2.4% |
| Alaska Natives | 0.0 /100 | #342 | Tragic 2.9% |
| Colville | 0.0 /100 | #343 | Tragic 3.3% |
| Inupiat | 0.0 /100 | #344 | Tragic 3.7% |
| Paiute | 0.0 /100 | #345 | Tragic 3.9% |
| Yup'ik | 0.0 /100 | #346 | Tragic 4.5% |
| Hopi | 0.0 /100 | #347 | Tragic 4.6% |
Demographics Similar to Immigrants from Denmark by Disability Age Under 5
In terms of disability age under 5, the demographic groups most similar to Immigrants from Denmark are West Indian (1.1%, a difference of 0.12%), Immigrants from Burma/Myanmar (1.1%, a difference of 0.14%), Hmong (1.1%, a difference of 0.14%), Immigrants from Trinidad and Tobago (1.1%, a difference of 0.16%), and Turkish (1.1%, a difference of 0.18%).
| Demographics | Rating | Rank | Disability Age Under 5 |
| Immigrants | Ecuador | 98.6 /100 | #70 | Exceptional 1.1% |
| Trinidadians and Tobagonians | 98.6 /100 | #71 | Exceptional 1.1% |
| Burmese | 98.5 /100 | #72 | Exceptional 1.1% |
| Immigrants | Sri Lanka | 98.5 /100 | #73 | Exceptional 1.1% |
| Jordanians | 98.5 /100 | #74 | Exceptional 1.1% |
| Immigrants | Pakistan | 98.4 /100 | #75 | Exceptional 1.1% |
| Immigrants | Burma/Myanmar | 98.2 /100 | #76 | Exceptional 1.1% |
| Immigrants | Denmark | 98.1 /100 | #77 | Exceptional 1.1% |
| West Indians | 98.0 /100 | #78 | Exceptional 1.1% |
| Hmong | 98.0 /100 | #79 | Exceptional 1.1% |
| Immigrants | Trinidad and Tobago | 98.0 /100 | #80 | Exceptional 1.1% |
| Turks | 98.0 /100 | #81 | Exceptional 1.1% |
| Immigrants | Jordan | 97.9 /100 | #82 | Exceptional 1.1% |
| Immigrants | Syria | 97.9 /100 | #83 | Exceptional 1.1% |
| Immigrants | Zaire | 97.8 /100 | #84 | Exceptional 1.1% |