Hopi vs Immigrants from Moldova Disability Age Under 5
COMPARE
Hopi
Immigrants from Moldova
Disability Age Under 5
Disability Age Under 5 Comparison
Hopi
Immigrants from Moldova
4.6%
DISABILITY AGE UNDER 5
0.0/ 100
METRIC RATING
347th/ 347
METRIC RANK
1.1%
DISABILITY AGE UNDER 5
96.8/ 100
METRIC RATING
95th/ 347
METRIC RANK
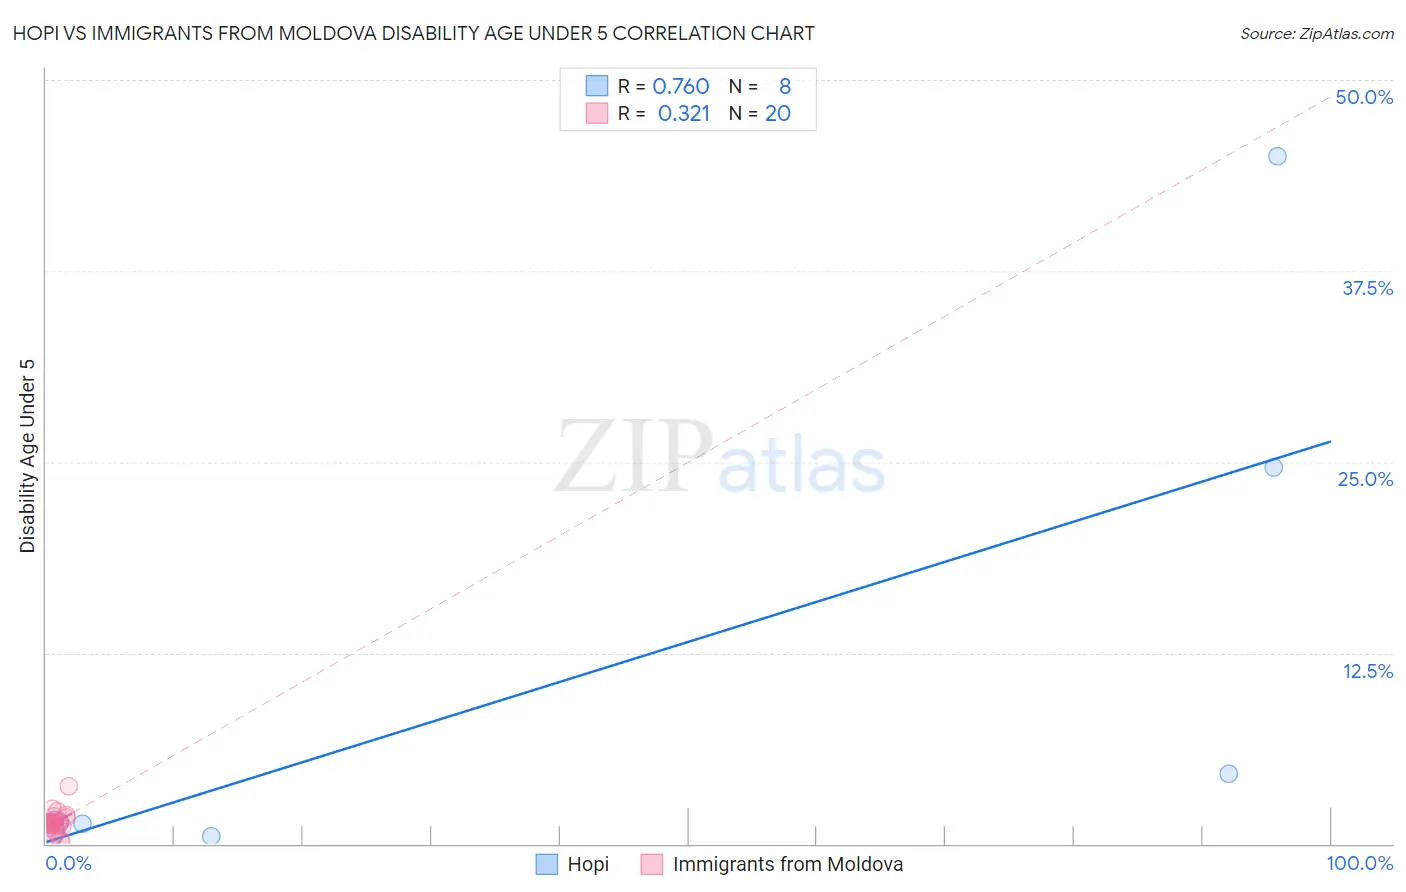
Hopi vs Immigrants from Moldova Disability Age Under 5 Correlation Chart
The statistical analysis conducted on geographies consisting of 60,809,841 people shows a strong positive correlation between the proportion of Hopi and percentage of population with a disability under the age of 5 in the United States with a correlation coefficient (R) of 0.760 and weighted average of 4.6%. Similarly, the statistical analysis conducted on geographies consisting of 88,816,891 people shows a mild positive correlation between the proportion of Immigrants from Moldova and percentage of population with a disability under the age of 5 in the United States with a correlation coefficient (R) of 0.321 and weighted average of 1.1%, a difference of 304.4%.
Disability Age Under 5 Correlation Summary
| Measurement | Hopi | Immigrants from Moldova |
| Minimum | 0.45% | 0.14% |
| Maximum | 45.0% | 3.7% |
| Range | 44.5% | 3.6% |
| Mean | 10.0% | 1.4% |
| Median | 1.5% | 1.3% |
| Interquartile 25% (IQ1) | 1.1% | 1.1% |
| Interquartile 75% (IQ3) | 14.6% | 1.8% |
| Interquartile Range (IQR) | 13.6% | 0.63% |
| Standard Deviation (Sample) | 16.3% | 0.77% |
| Standard Deviation (Population) | 15.3% | 0.75% |
Similar Demographics by Disability Age Under 5
Demographics Similar to Hopi by Disability Age Under 5
In terms of disability age under 5, the demographic groups most similar to Hopi are Yup'ik (4.5%, a difference of 2.3%), Paiute (3.9%, a difference of 18.4%), Inupiat (3.7%, a difference of 24.8%), Colville (3.3%, a difference of 41.0%), and Alaska Native (2.9%, a difference of 57.3%).
| Demographics | Rating | Rank | Disability Age Under 5 |
| Dutch West Indians | 0.0 /100 | #333 | Tragic 1.9% |
| Natives/Alaskans | 0.0 /100 | #334 | Tragic 1.9% |
| Pennsylvania Germans | 0.0 /100 | #335 | Tragic 1.9% |
| Paraguayans | 0.0 /100 | #336 | Tragic 2.0% |
| Apache | 0.0 /100 | #337 | Tragic 2.0% |
| Tohono O'odham | 0.0 /100 | #338 | Tragic 2.2% |
| Immigrants | Azores | 0.0 /100 | #339 | Tragic 2.2% |
| Menominee | 0.0 /100 | #340 | Tragic 2.3% |
| Tsimshian | 0.0 /100 | #341 | Tragic 2.4% |
| Alaska Natives | 0.0 /100 | #342 | Tragic 2.9% |
| Colville | 0.0 /100 | #343 | Tragic 3.3% |
| Inupiat | 0.0 /100 | #344 | Tragic 3.7% |
| Paiute | 0.0 /100 | #345 | Tragic 3.9% |
| Yup'ik | 0.0 /100 | #346 | Tragic 4.5% |
| Hopi | 0.0 /100 | #347 | Tragic 4.6% |
Demographics Similar to Immigrants from Moldova by Disability Age Under 5
In terms of disability age under 5, the demographic groups most similar to Immigrants from Moldova are Sri Lankan (1.1%, a difference of 0.050%), Mongolian (1.1%, a difference of 0.10%), Spanish American (1.1%, a difference of 0.11%), Immigrants from Cuba (1.1%, a difference of 0.14%), and Immigrants from Iraq (1.1%, a difference of 0.20%).
| Demographics | Rating | Rank | Disability Age Under 5 |
| Immigrants | Dominican Republic | 97.5 /100 | #88 | Exceptional 1.1% |
| Ethiopians | 97.2 /100 | #89 | Exceptional 1.1% |
| Chinese | 97.2 /100 | #90 | Exceptional 1.1% |
| Albanians | 97.2 /100 | #91 | Exceptional 1.1% |
| Immigrants | Cuba | 97.0 /100 | #92 | Exceptional 1.1% |
| Spanish Americans | 96.9 /100 | #93 | Exceptional 1.1% |
| Sri Lankans | 96.8 /100 | #94 | Exceptional 1.1% |
| Immigrants | Moldova | 96.8 /100 | #95 | Exceptional 1.1% |
| Mongolians | 96.6 /100 | #96 | Exceptional 1.1% |
| Immigrants | Iraq | 96.5 /100 | #97 | Exceptional 1.1% |
| Immigrants | South Eastern Asia | 96.5 /100 | #98 | Exceptional 1.1% |
| Dominicans | 96.3 /100 | #99 | Exceptional 1.1% |
| Nicaraguans | 96.3 /100 | #100 | Exceptional 1.1% |
| Immigrants | Uganda | 96.1 /100 | #101 | Exceptional 1.1% |
| Immigrants | Morocco | 96.0 /100 | #102 | Exceptional 1.2% |