Hopi vs Asian Disability Age Under 5
COMPARE
Hopi
Asian
Disability Age Under 5
Disability Age Under 5 Comparison
Hopi
Asians
4.6%
DISABILITY AGE UNDER 5
0.0/ 100
METRIC RATING
347th/ 347
METRIC RANK
1.1%
DISABILITY AGE UNDER 5
99.6/ 100
METRIC RATING
53rd/ 347
METRIC RANK
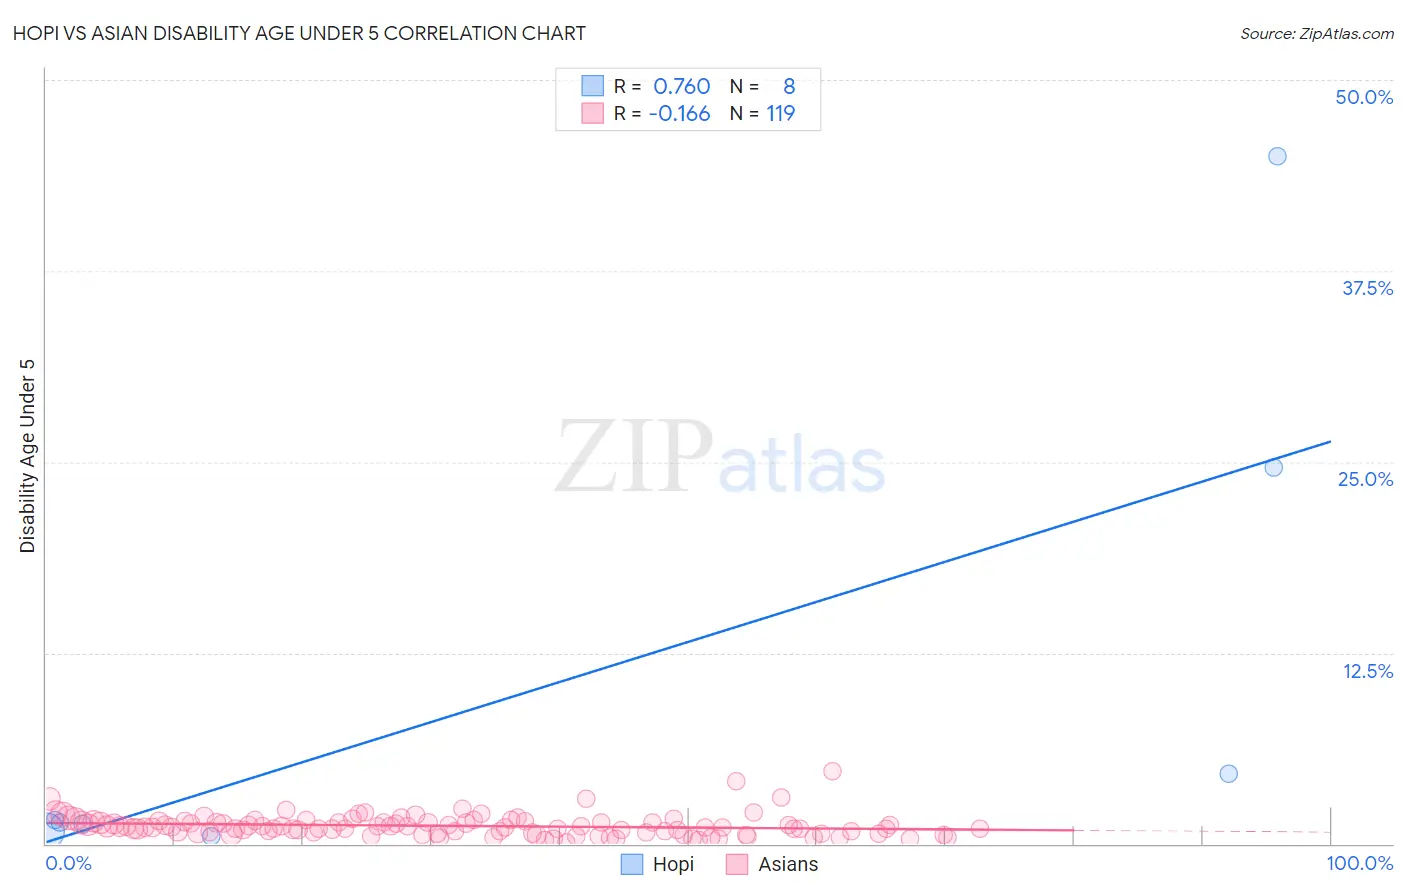
Hopi vs Asian Disability Age Under 5 Correlation Chart
The statistical analysis conducted on geographies consisting of 60,809,841 people shows a strong positive correlation between the proportion of Hopi and percentage of population with a disability under the age of 5 in the United States with a correlation coefficient (R) of 0.760 and weighted average of 4.6%. Similarly, the statistical analysis conducted on geographies consisting of 258,933,212 people shows a poor negative correlation between the proportion of Asians and percentage of population with a disability under the age of 5 in the United States with a correlation coefficient (R) of -0.166 and weighted average of 1.1%, a difference of 326.6%.
Disability Age Under 5 Correlation Summary
| Measurement | Hopi | Asian |
| Minimum | 0.45% | 0.058% |
| Maximum | 45.0% | 4.7% |
| Range | 44.5% | 4.7% |
| Mean | 10.0% | 1.2% |
| Median | 1.5% | 1.1% |
| Interquartile 25% (IQ1) | 1.1% | 0.73% |
| Interquartile 75% (IQ3) | 14.6% | 1.4% |
| Interquartile Range (IQR) | 13.6% | 0.69% |
| Standard Deviation (Sample) | 16.3% | 0.71% |
| Standard Deviation (Population) | 15.3% | 0.70% |
Similar Demographics by Disability Age Under 5
Demographics Similar to Hopi by Disability Age Under 5
In terms of disability age under 5, the demographic groups most similar to Hopi are Yup'ik (4.5%, a difference of 2.3%), Paiute (3.9%, a difference of 18.4%), Inupiat (3.7%, a difference of 24.8%), Colville (3.3%, a difference of 41.0%), and Alaska Native (2.9%, a difference of 57.3%).
| Demographics | Rating | Rank | Disability Age Under 5 |
| Dutch West Indians | 0.0 /100 | #333 | Tragic 1.9% |
| Natives/Alaskans | 0.0 /100 | #334 | Tragic 1.9% |
| Pennsylvania Germans | 0.0 /100 | #335 | Tragic 1.9% |
| Paraguayans | 0.0 /100 | #336 | Tragic 2.0% |
| Apache | 0.0 /100 | #337 | Tragic 2.0% |
| Tohono O'odham | 0.0 /100 | #338 | Tragic 2.2% |
| Immigrants | Azores | 0.0 /100 | #339 | Tragic 2.2% |
| Menominee | 0.0 /100 | #340 | Tragic 2.3% |
| Tsimshian | 0.0 /100 | #341 | Tragic 2.4% |
| Alaska Natives | 0.0 /100 | #342 | Tragic 2.9% |
| Colville | 0.0 /100 | #343 | Tragic 3.3% |
| Inupiat | 0.0 /100 | #344 | Tragic 3.7% |
| Paiute | 0.0 /100 | #345 | Tragic 3.9% |
| Yup'ik | 0.0 /100 | #346 | Tragic 4.5% |
| Hopi | 0.0 /100 | #347 | Tragic 4.6% |
Demographics Similar to Asians by Disability Age Under 5
In terms of disability age under 5, the demographic groups most similar to Asians are Immigrants from El Salvador (1.1%, a difference of 0.29%), Immigrants from Bolivia (1.1%, a difference of 0.31%), Salvadoran (1.1%, a difference of 0.38%), Immigrants from Kazakhstan (1.1%, a difference of 0.74%), and Ecuadorian (1.1%, a difference of 0.78%).
| Demographics | Rating | Rank | Disability Age Under 5 |
| Immigrants | Congo | 99.8 /100 | #46 | Exceptional 1.1% |
| Immigrants | Sweden | 99.8 /100 | #47 | Exceptional 1.1% |
| Immigrants | Singapore | 99.7 /100 | #48 | Exceptional 1.1% |
| Immigrants | Russia | 99.7 /100 | #49 | Exceptional 1.1% |
| Immigrants | Japan | 99.7 /100 | #50 | Exceptional 1.1% |
| Immigrants | Kazakhstan | 99.7 /100 | #51 | Exceptional 1.1% |
| Immigrants | Bolivia | 99.6 /100 | #52 | Exceptional 1.1% |
| Asians | 99.6 /100 | #53 | Exceptional 1.1% |
| Immigrants | El Salvador | 99.6 /100 | #54 | Exceptional 1.1% |
| Salvadorans | 99.5 /100 | #55 | Exceptional 1.1% |
| Ecuadorians | 99.5 /100 | #56 | Exceptional 1.1% |
| Assyrians/Chaldeans/Syriacs | 99.5 /100 | #57 | Exceptional 1.1% |
| Immigrants | Egypt | 99.4 /100 | #58 | Exceptional 1.1% |
| Immigrants | Malaysia | 99.4 /100 | #59 | Exceptional 1.1% |
| Immigrants | Western Asia | 99.2 /100 | #60 | Exceptional 1.1% |