Hopi vs Immigrants from Netherlands Disability Age Under 5
COMPARE
Hopi
Immigrants from Netherlands
Disability Age Under 5
Disability Age Under 5 Comparison
Hopi
Immigrants from Netherlands
4.6%
DISABILITY AGE UNDER 5
0.0/ 100
METRIC RATING
347th/ 347
METRIC RANK
1.4%
DISABILITY AGE UNDER 5
0.2/ 100
METRIC RATING
261st/ 347
METRIC RANK
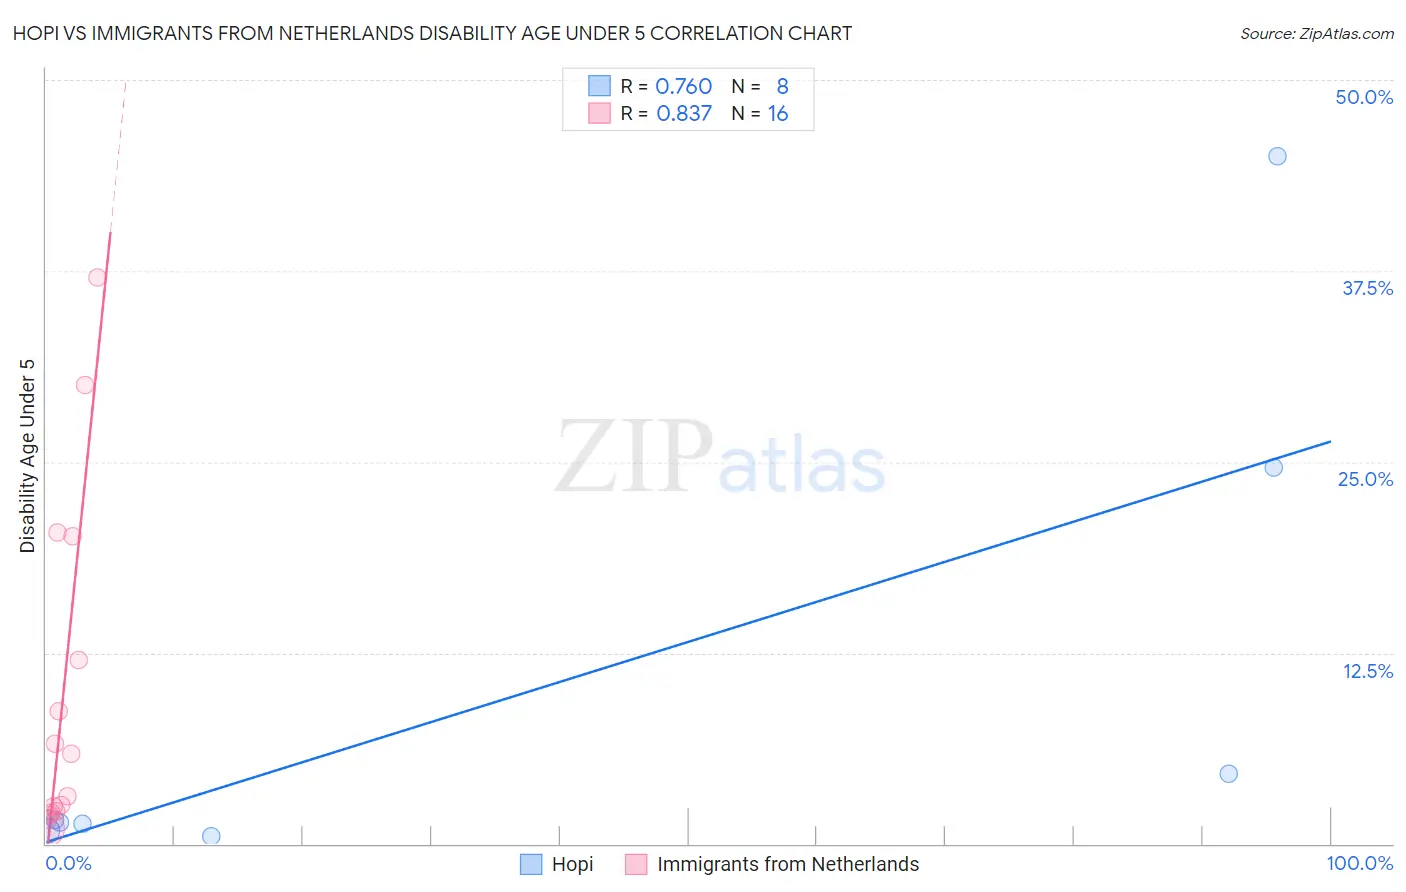
Hopi vs Immigrants from Netherlands Disability Age Under 5 Correlation Chart
The statistical analysis conducted on geographies consisting of 60,809,841 people shows a strong positive correlation between the proportion of Hopi and percentage of population with a disability under the age of 5 in the United States with a correlation coefficient (R) of 0.760 and weighted average of 4.6%. Similarly, the statistical analysis conducted on geographies consisting of 148,496,878 people shows a very strong positive correlation between the proportion of Immigrants from Netherlands and percentage of population with a disability under the age of 5 in the United States with a correlation coefficient (R) of 0.837 and weighted average of 1.4%, a difference of 226.6%.
Disability Age Under 5 Correlation Summary
| Measurement | Hopi | Immigrants from Netherlands |
| Minimum | 0.45% | 0.96% |
| Maximum | 45.0% | 37.0% |
| Range | 44.5% | 36.1% |
| Mean | 10.0% | 9.8% |
| Median | 1.5% | 4.5% |
| Interquartile 25% (IQ1) | 1.1% | 2.1% |
| Interquartile 75% (IQ3) | 14.6% | 16.1% |
| Interquartile Range (IQR) | 13.6% | 14.0% |
| Standard Deviation (Sample) | 16.3% | 11.2% |
| Standard Deviation (Population) | 15.3% | 10.8% |
Similar Demographics by Disability Age Under 5
Demographics Similar to Hopi by Disability Age Under 5
In terms of disability age under 5, the demographic groups most similar to Hopi are Yup'ik (4.5%, a difference of 2.3%), Paiute (3.9%, a difference of 18.4%), Inupiat (3.7%, a difference of 24.8%), Colville (3.3%, a difference of 41.0%), and Alaska Native (2.9%, a difference of 57.3%).
| Demographics | Rating | Rank | Disability Age Under 5 |
| Dutch West Indians | 0.0 /100 | #333 | Tragic 1.9% |
| Natives/Alaskans | 0.0 /100 | #334 | Tragic 1.9% |
| Pennsylvania Germans | 0.0 /100 | #335 | Tragic 1.9% |
| Paraguayans | 0.0 /100 | #336 | Tragic 2.0% |
| Apache | 0.0 /100 | #337 | Tragic 2.0% |
| Tohono O'odham | 0.0 /100 | #338 | Tragic 2.2% |
| Immigrants | Azores | 0.0 /100 | #339 | Tragic 2.2% |
| Menominee | 0.0 /100 | #340 | Tragic 2.3% |
| Tsimshian | 0.0 /100 | #341 | Tragic 2.4% |
| Alaska Natives | 0.0 /100 | #342 | Tragic 2.9% |
| Colville | 0.0 /100 | #343 | Tragic 3.3% |
| Inupiat | 0.0 /100 | #344 | Tragic 3.7% |
| Paiute | 0.0 /100 | #345 | Tragic 3.9% |
| Yup'ik | 0.0 /100 | #346 | Tragic 4.5% |
| Hopi | 0.0 /100 | #347 | Tragic 4.6% |
Demographics Similar to Immigrants from Netherlands by Disability Age Under 5
In terms of disability age under 5, the demographic groups most similar to Immigrants from Netherlands are Immigrants from Dominica (1.4%, a difference of 0.16%), Spanish (1.4%, a difference of 0.22%), Yugoslavian (1.4%, a difference of 0.37%), Carpatho Rusyn (1.4%, a difference of 0.41%), and Immigrants from Germany (1.4%, a difference of 0.44%).
| Demographics | Rating | Rank | Disability Age Under 5 |
| Immigrants | Brazil | 0.7 /100 | #254 | Tragic 1.4% |
| Immigrants | Liberia | 0.6 /100 | #255 | Tragic 1.4% |
| Immigrants | Western Europe | 0.5 /100 | #256 | Tragic 1.4% |
| Slovenes | 0.3 /100 | #257 | Tragic 1.4% |
| Costa Ricans | 0.3 /100 | #258 | Tragic 1.4% |
| Immigrants | Southern Europe | 0.3 /100 | #259 | Tragic 1.4% |
| Slavs | 0.3 /100 | #260 | Tragic 1.4% |
| Immigrants | Netherlands | 0.2 /100 | #261 | Tragic 1.4% |
| Immigrants | Dominica | 0.2 /100 | #262 | Tragic 1.4% |
| Spanish | 0.2 /100 | #263 | Tragic 1.4% |
| Yugoslavians | 0.1 /100 | #264 | Tragic 1.4% |
| Carpatho Rusyns | 0.1 /100 | #265 | Tragic 1.4% |
| Immigrants | Germany | 0.1 /100 | #266 | Tragic 1.4% |
| Cree | 0.1 /100 | #267 | Tragic 1.4% |
| Belgians | 0.1 /100 | #268 | Tragic 1.4% |