Hopi vs Bahamian Disability Age Under 5
COMPARE
Hopi
Bahamian
Disability Age Under 5
Disability Age Under 5 Comparison
Hopi
Bahamians
4.6%
DISABILITY AGE UNDER 5
0.0/ 100
METRIC RATING
347th/ 347
METRIC RANK
1.3%
DISABILITY AGE UNDER 5
7.1/ 100
METRIC RATING
226th/ 347
METRIC RANK
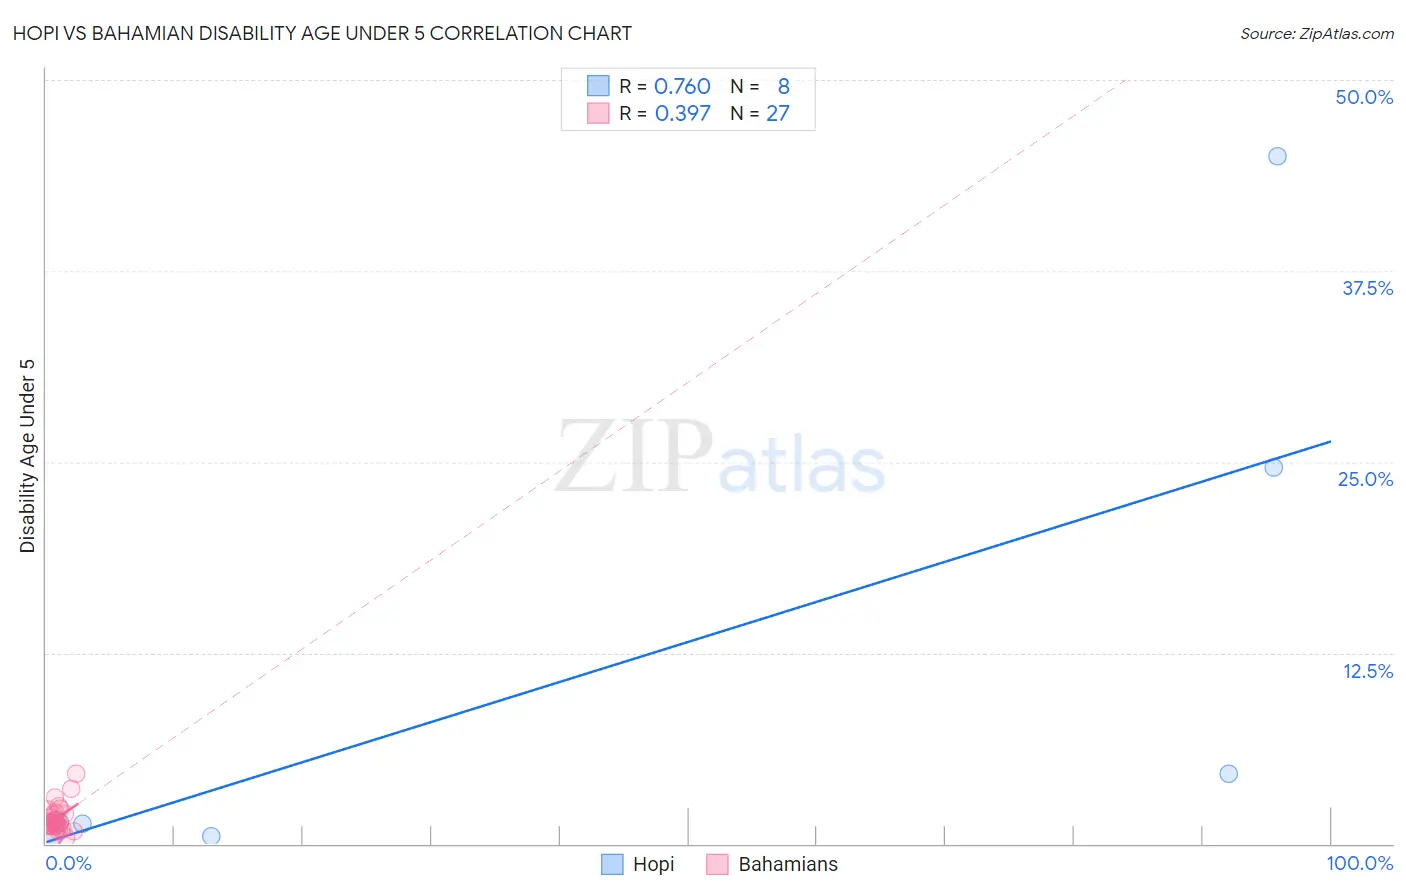
Hopi vs Bahamian Disability Age Under 5 Correlation Chart
The statistical analysis conducted on geographies consisting of 60,809,841 people shows a strong positive correlation between the proportion of Hopi and percentage of population with a disability under the age of 5 in the United States with a correlation coefficient (R) of 0.760 and weighted average of 4.6%. Similarly, the statistical analysis conducted on geographies consisting of 81,811,004 people shows a mild positive correlation between the proportion of Bahamians and percentage of population with a disability under the age of 5 in the United States with a correlation coefficient (R) of 0.397 and weighted average of 1.3%, a difference of 252.7%.
Disability Age Under 5 Correlation Summary
| Measurement | Hopi | Bahamian |
| Minimum | 0.45% | 0.43% |
| Maximum | 45.0% | 4.6% |
| Range | 44.5% | 4.1% |
| Mean | 10.0% | 1.7% |
| Median | 1.5% | 1.3% |
| Interquartile 25% (IQ1) | 1.1% | 1.1% |
| Interquartile 75% (IQ3) | 14.6% | 2.0% |
| Interquartile Range (IQR) | 13.6% | 0.92% |
| Standard Deviation (Sample) | 16.3% | 0.92% |
| Standard Deviation (Population) | 15.3% | 0.90% |
Similar Demographics by Disability Age Under 5
Demographics Similar to Hopi by Disability Age Under 5
In terms of disability age under 5, the demographic groups most similar to Hopi are Yup'ik (4.5%, a difference of 2.3%), Paiute (3.9%, a difference of 18.4%), Inupiat (3.7%, a difference of 24.8%), Colville (3.3%, a difference of 41.0%), and Alaska Native (2.9%, a difference of 57.3%).
| Demographics | Rating | Rank | Disability Age Under 5 |
| Dutch West Indians | 0.0 /100 | #333 | Tragic 1.9% |
| Natives/Alaskans | 0.0 /100 | #334 | Tragic 1.9% |
| Pennsylvania Germans | 0.0 /100 | #335 | Tragic 1.9% |
| Paraguayans | 0.0 /100 | #336 | Tragic 2.0% |
| Apache | 0.0 /100 | #337 | Tragic 2.0% |
| Tohono O'odham | 0.0 /100 | #338 | Tragic 2.2% |
| Immigrants | Azores | 0.0 /100 | #339 | Tragic 2.2% |
| Menominee | 0.0 /100 | #340 | Tragic 2.3% |
| Tsimshian | 0.0 /100 | #341 | Tragic 2.4% |
| Alaska Natives | 0.0 /100 | #342 | Tragic 2.9% |
| Colville | 0.0 /100 | #343 | Tragic 3.3% |
| Inupiat | 0.0 /100 | #344 | Tragic 3.7% |
| Paiute | 0.0 /100 | #345 | Tragic 3.9% |
| Yup'ik | 0.0 /100 | #346 | Tragic 4.5% |
| Hopi | 0.0 /100 | #347 | Tragic 4.6% |
Demographics Similar to Bahamians by Disability Age Under 5
In terms of disability age under 5, the demographic groups most similar to Bahamians are Panamanian (1.3%, a difference of 0.0%), Latvian (1.3%, a difference of 0.030%), Hispanic or Latino (1.3%, a difference of 0.19%), Taiwanese (1.3%, a difference of 0.34%), and Luxembourger (1.3%, a difference of 0.35%).
| Demographics | Rating | Rank | Disability Age Under 5 |
| Immigrants | Croatia | 11.2 /100 | #219 | Poor 1.3% |
| Serbians | 9.6 /100 | #220 | Tragic 1.3% |
| Sub-Saharan Africans | 8.3 /100 | #221 | Tragic 1.3% |
| Ukrainians | 8.3 /100 | #222 | Tragic 1.3% |
| Hispanics or Latinos | 7.7 /100 | #223 | Tragic 1.3% |
| Latvians | 7.1 /100 | #224 | Tragic 1.3% |
| Panamanians | 7.1 /100 | #225 | Tragic 1.3% |
| Bahamians | 7.1 /100 | #226 | Tragic 1.3% |
| Taiwanese | 6.1 /100 | #227 | Tragic 1.3% |
| Luxembourgers | 6.1 /100 | #228 | Tragic 1.3% |
| Immigrants | Costa Rica | 5.5 /100 | #229 | Tragic 1.3% |
| Lebanese | 5.3 /100 | #230 | Tragic 1.3% |
| Immigrants | Northern Europe | 4.7 /100 | #231 | Tragic 1.3% |
| French American Indians | 4.5 /100 | #232 | Tragic 1.3% |
| Tongans | 4.2 /100 | #233 | Tragic 1.3% |