Immigrants from Armenia vs Immigrants from Denmark Disability Age Under 5
COMPARE
Immigrants from Armenia
Immigrants from Denmark
Disability Age Under 5
Disability Age Under 5 Comparison
Immigrants from Armenia
Immigrants from Denmark
0.76%
DISABILITY AGE UNDER 5
100.0/ 100
METRIC RATING
1st/ 347
METRIC RANK
1.1%
DISABILITY AGE UNDER 5
98.1/ 100
METRIC RATING
77th/ 347
METRIC RANK
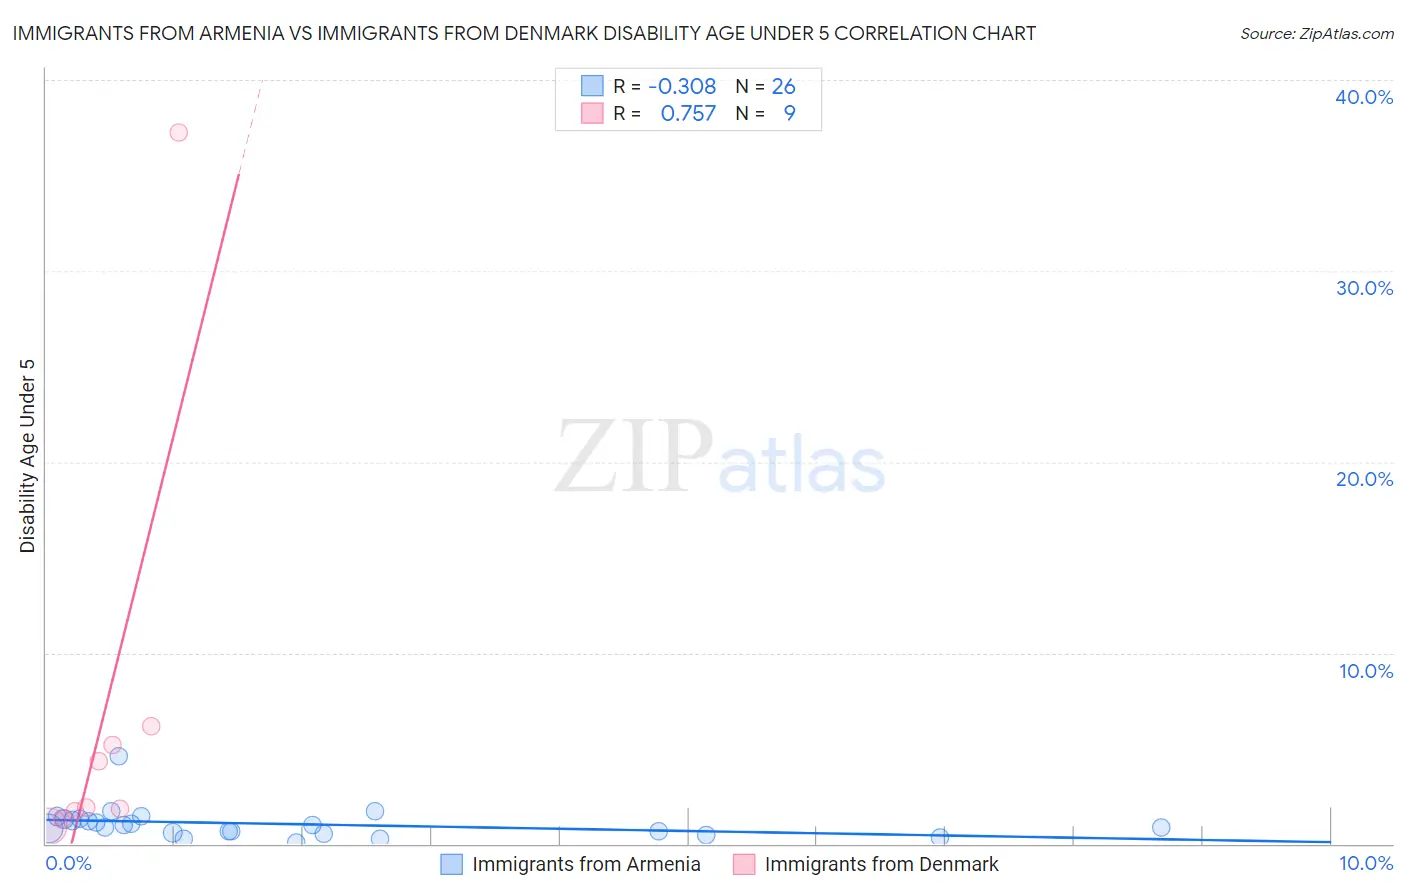
Immigrants from Armenia vs Immigrants from Denmark Disability Age Under 5 Correlation Chart
The statistical analysis conducted on geographies consisting of 73,758,822 people shows a mild negative correlation between the proportion of Immigrants from Armenia and percentage of population with a disability under the age of 5 in the United States with a correlation coefficient (R) of -0.308 and weighted average of 0.76%. Similarly, the statistical analysis conducted on geographies consisting of 97,246,779 people shows a strong positive correlation between the proportion of Immigrants from Denmark and percentage of population with a disability under the age of 5 in the United States with a correlation coefficient (R) of 0.757 and weighted average of 1.1%, a difference of 49.3%.
Disability Age Under 5 Correlation Summary
| Measurement | Immigrants from Armenia | Immigrants from Denmark |
| Minimum | 0.070% | 0.89% |
| Maximum | 4.6% | 37.3% |
| Range | 4.5% | 36.4% |
| Mean | 1.0% | 6.7% |
| Median | 0.90% | 1.9% |
| Interquartile 25% (IQ1) | 0.57% | 1.5% |
| Interquartile 75% (IQ3) | 1.3% | 5.7% |
| Interquartile Range (IQR) | 0.73% | 4.1% |
| Standard Deviation (Sample) | 0.84% | 11.6% |
| Standard Deviation (Population) | 0.83% | 10.9% |
Similar Demographics by Disability Age Under 5
Demographics Similar to Immigrants from Armenia by Disability Age Under 5
In terms of disability age under 5, the demographic groups most similar to Immigrants from Armenia are Immigrants from St. Vincent and the Grenadines (0.79%, a difference of 4.1%), Vietnamese (0.81%, a difference of 7.4%), Immigrants from Uzbekistan (0.85%, a difference of 12.3%), Immigrants from Bangladesh (0.85%, a difference of 12.8%), and Ute (0.86%, a difference of 13.8%).
| Demographics | Rating | Rank | Disability Age Under 5 |
| Immigrants | Armenia | 100.0 /100 | #1 | Exceptional 0.76% |
| Immigrants | St. Vincent and the Grenadines | 100.0 /100 | #2 | Exceptional 0.79% |
| Vietnamese | 100.0 /100 | #3 | Exceptional 0.81% |
| Immigrants | Uzbekistan | 100.0 /100 | #4 | Exceptional 0.85% |
| Immigrants | Bangladesh | 100.0 /100 | #5 | Exceptional 0.85% |
| Ute | 100.0 /100 | #6 | Exceptional 0.86% |
| Immigrants | Afghanistan | 100.0 /100 | #7 | Exceptional 0.91% |
| Immigrants | Yemen | 100.0 /100 | #8 | Exceptional 0.91% |
| Immigrants | Fiji | 100.0 /100 | #9 | Exceptional 0.92% |
| Marshallese | 100.0 /100 | #10 | Exceptional 0.94% |
| Afghans | 100.0 /100 | #11 | Exceptional 0.94% |
| Immigrants | Grenada | 100.0 /100 | #12 | Exceptional 0.94% |
| Soviet Union | 100.0 /100 | #13 | Exceptional 0.95% |
| Yuman | 100.0 /100 | #14 | Exceptional 0.95% |
| Immigrants | Hong Kong | 100.0 /100 | #15 | Exceptional 0.95% |
Demographics Similar to Immigrants from Denmark by Disability Age Under 5
In terms of disability age under 5, the demographic groups most similar to Immigrants from Denmark are West Indian (1.1%, a difference of 0.12%), Immigrants from Burma/Myanmar (1.1%, a difference of 0.14%), Hmong (1.1%, a difference of 0.14%), Immigrants from Trinidad and Tobago (1.1%, a difference of 0.16%), and Turkish (1.1%, a difference of 0.18%).
| Demographics | Rating | Rank | Disability Age Under 5 |
| Immigrants | Ecuador | 98.6 /100 | #70 | Exceptional 1.1% |
| Trinidadians and Tobagonians | 98.6 /100 | #71 | Exceptional 1.1% |
| Burmese | 98.5 /100 | #72 | Exceptional 1.1% |
| Immigrants | Sri Lanka | 98.5 /100 | #73 | Exceptional 1.1% |
| Jordanians | 98.5 /100 | #74 | Exceptional 1.1% |
| Immigrants | Pakistan | 98.4 /100 | #75 | Exceptional 1.1% |
| Immigrants | Burma/Myanmar | 98.2 /100 | #76 | Exceptional 1.1% |
| Immigrants | Denmark | 98.1 /100 | #77 | Exceptional 1.1% |
| West Indians | 98.0 /100 | #78 | Exceptional 1.1% |
| Hmong | 98.0 /100 | #79 | Exceptional 1.1% |
| Immigrants | Trinidad and Tobago | 98.0 /100 | #80 | Exceptional 1.1% |
| Turks | 98.0 /100 | #81 | Exceptional 1.1% |
| Immigrants | Jordan | 97.9 /100 | #82 | Exceptional 1.1% |
| Immigrants | Syria | 97.9 /100 | #83 | Exceptional 1.1% |
| Immigrants | Zaire | 97.8 /100 | #84 | Exceptional 1.1% |