Hopi vs Immigrants from Denmark 8th Grade
COMPARE
Hopi
Immigrants from Denmark
8th Grade
8th Grade Comparison
Hopi
Immigrants from Denmark
95.9%
8TH GRADE
79.4/ 100
METRIC RATING
154th/ 347
METRIC RANK
96.4%
8TH GRADE
98.8/ 100
METRIC RATING
93rd/ 347
METRIC RANK
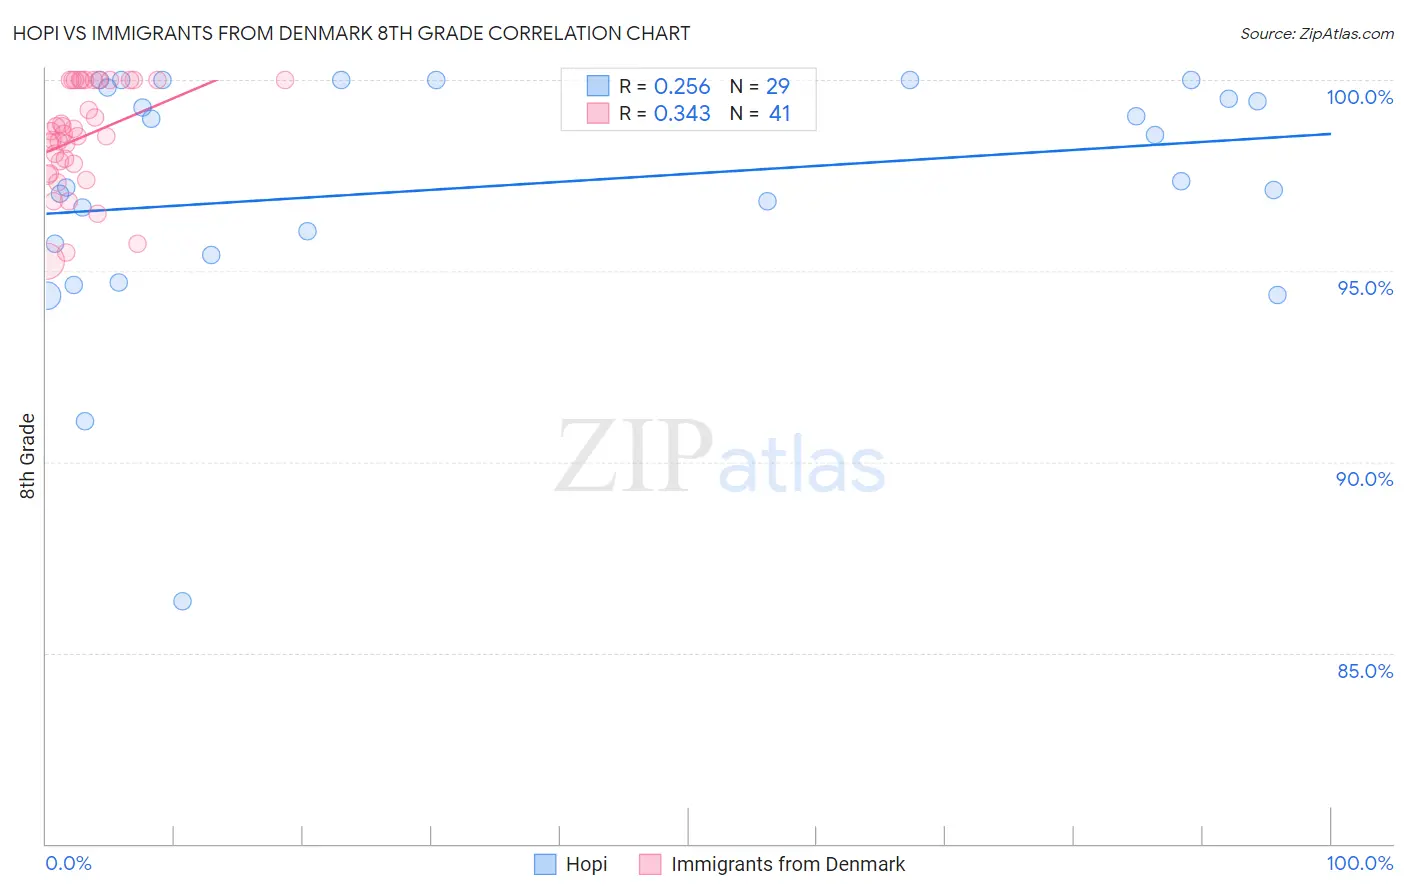
Hopi vs Immigrants from Denmark 8th Grade Correlation Chart
The statistical analysis conducted on geographies consisting of 74,739,957 people shows a weak positive correlation between the proportion of Hopi and percentage of population with at least 8th grade education in the United States with a correlation coefficient (R) of 0.256 and weighted average of 95.9%. Similarly, the statistical analysis conducted on geographies consisting of 136,430,932 people shows a mild positive correlation between the proportion of Immigrants from Denmark and percentage of population with at least 8th grade education in the United States with a correlation coefficient (R) of 0.343 and weighted average of 96.4%, a difference of 0.50%.
8th Grade Correlation Summary
| Measurement | Hopi | Immigrants from Denmark |
| Minimum | 86.4% | 95.2% |
| Maximum | 100.0% | 100.0% |
| Range | 13.6% | 4.8% |
| Mean | 97.2% | 98.5% |
| Median | 97.4% | 98.6% |
| Interquartile 25% (IQ1) | 95.6% | 97.7% |
| Interquartile 75% (IQ3) | 99.9% | 100.0% |
| Interquartile Range (IQR) | 4.3% | 2.3% |
| Standard Deviation (Sample) | 3.1% | 1.4% |
| Standard Deviation (Population) | 3.1% | 1.3% |
Similar Demographics by 8th Grade
Demographics Similar to Hopi by 8th Grade
In terms of 8th grade, the demographic groups most similar to Hopi are Immigrants from Jordan (95.9%, a difference of 0.0%), Blackfeet (96.0%, a difference of 0.010%), French American Indian (96.0%, a difference of 0.010%), Immigrants from Israel (96.0%, a difference of 0.020%), and Immigrants from Russia (96.0%, a difference of 0.020%).
| Demographics | Rating | Rank | 8th Grade |
| Colville | 84.0 /100 | #147 | Excellent 96.0% |
| Albanians | 83.1 /100 | #148 | Excellent 96.0% |
| Immigrants | Israel | 81.3 /100 | #149 | Excellent 96.0% |
| Immigrants | Russia | 80.9 /100 | #150 | Excellent 96.0% |
| Blackfeet | 80.8 /100 | #151 | Excellent 96.0% |
| French American Indians | 80.6 /100 | #152 | Excellent 96.0% |
| Immigrants | Jordan | 79.5 /100 | #153 | Good 95.9% |
| Hopi | 79.4 /100 | #154 | Good 95.9% |
| Kenyans | 74.5 /100 | #155 | Good 95.9% |
| Ugandans | 74.1 /100 | #156 | Good 95.9% |
| Immigrants | Taiwan | 70.5 /100 | #157 | Good 95.9% |
| Arabs | 69.4 /100 | #158 | Good 95.9% |
| Immigrants | Kazakhstan | 68.4 /100 | #159 | Good 95.9% |
| Seminole | 67.7 /100 | #160 | Good 95.8% |
| Bermudans | 67.5 /100 | #161 | Good 95.8% |
Demographics Similar to Immigrants from Denmark by 8th Grade
In terms of 8th grade, the demographic groups most similar to Immigrants from Denmark are Immigrants from Sweden (96.4%, a difference of 0.0%), Thai (96.4%, a difference of 0.0%), Menominee (96.4%, a difference of 0.0%), Chickasaw (96.4%, a difference of 0.010%), and Immigrants from Singapore (96.4%, a difference of 0.010%).
| Demographics | Rating | Rank | 8th Grade |
| Cherokee | 99.0 /100 | #86 | Exceptional 96.5% |
| Immigrants | Australia | 99.0 /100 | #87 | Exceptional 96.5% |
| Immigrants | Western Europe | 99.0 /100 | #88 | Exceptional 96.4% |
| Chickasaw | 98.9 /100 | #89 | Exceptional 96.4% |
| Immigrants | Sweden | 98.9 /100 | #90 | Exceptional 96.4% |
| Thais | 98.9 /100 | #91 | Exceptional 96.4% |
| Menominee | 98.9 /100 | #92 | Exceptional 96.4% |
| Immigrants | Denmark | 98.8 /100 | #93 | Exceptional 96.4% |
| Immigrants | Singapore | 98.8 /100 | #94 | Exceptional 96.4% |
| German Russians | 98.8 /100 | #95 | Exceptional 96.4% |
| Potawatomi | 98.7 /100 | #96 | Exceptional 96.4% |
| Osage | 98.7 /100 | #97 | Exceptional 96.4% |
| Immigrants | Germany | 98.7 /100 | #98 | Exceptional 96.4% |
| Cree | 98.6 /100 | #99 | Exceptional 96.4% |
| Immigrants | Czechoslovakia | 98.6 /100 | #100 | Exceptional 96.4% |