Indonesian vs Immigrants from Denmark Disability Age Under 5
COMPARE
Indonesian
Immigrants from Denmark
Disability Age Under 5
Disability Age Under 5 Comparison
Indonesians
Immigrants from Denmark
1.2%
DISABILITY AGE UNDER 5
95.9/ 100
METRIC RATING
104th/ 347
METRIC RANK
1.1%
DISABILITY AGE UNDER 5
98.1/ 100
METRIC RATING
77th/ 347
METRIC RANK
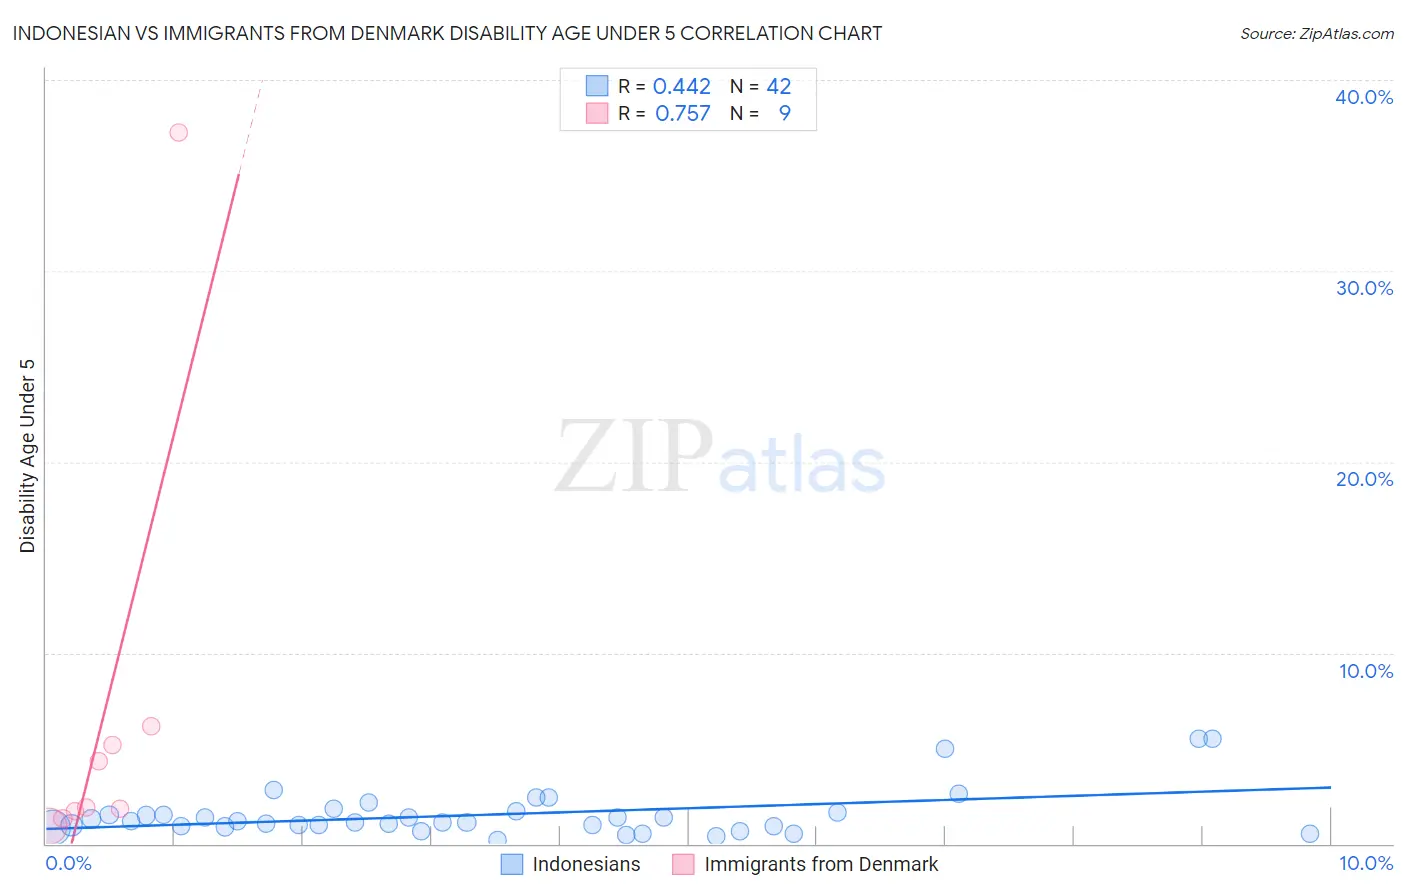
Indonesian vs Immigrants from Denmark Disability Age Under 5 Correlation Chart
The statistical analysis conducted on geographies consisting of 116,670,957 people shows a moderate positive correlation between the proportion of Indonesians and percentage of population with a disability under the age of 5 in the United States with a correlation coefficient (R) of 0.442 and weighted average of 1.2%. Similarly, the statistical analysis conducted on geographies consisting of 97,246,779 people shows a strong positive correlation between the proportion of Immigrants from Denmark and percentage of population with a disability under the age of 5 in the United States with a correlation coefficient (R) of 0.757 and weighted average of 1.1%, a difference of 2.0%.
Disability Age Under 5 Correlation Summary
| Measurement | Indonesian | Immigrants from Denmark |
| Minimum | 0.21% | 0.89% |
| Maximum | 5.5% | 37.3% |
| Range | 5.3% | 36.4% |
| Mean | 1.5% | 6.7% |
| Median | 1.1% | 1.9% |
| Interquartile 25% (IQ1) | 0.90% | 1.5% |
| Interquartile 75% (IQ3) | 1.7% | 5.7% |
| Interquartile Range (IQR) | 0.76% | 4.1% |
| Standard Deviation (Sample) | 1.2% | 11.6% |
| Standard Deviation (Population) | 1.2% | 10.9% |
Similar Demographics by Disability Age Under 5
Demographics Similar to Indonesians by Disability Age Under 5
In terms of disability age under 5, the demographic groups most similar to Indonesians are Immigrants from Morocco (1.2%, a difference of 0.070%), Immigrants from Nicaragua (1.2%, a difference of 0.070%), Immigrants from Uganda (1.1%, a difference of 0.12%), Immigrants from South Africa (1.2%, a difference of 0.19%), and Nicaraguan (1.1%, a difference of 0.24%).
| Demographics | Rating | Rank | Disability Age Under 5 |
| Immigrants | Iraq | 96.5 /100 | #97 | Exceptional 1.1% |
| Immigrants | South Eastern Asia | 96.5 /100 | #98 | Exceptional 1.1% |
| Dominicans | 96.3 /100 | #99 | Exceptional 1.1% |
| Nicaraguans | 96.3 /100 | #100 | Exceptional 1.1% |
| Immigrants | Uganda | 96.1 /100 | #101 | Exceptional 1.1% |
| Immigrants | Morocco | 96.0 /100 | #102 | Exceptional 1.2% |
| Immigrants | Nicaragua | 96.0 /100 | #103 | Exceptional 1.2% |
| Indonesians | 95.9 /100 | #104 | Exceptional 1.2% |
| Immigrants | South Africa | 95.6 /100 | #105 | Exceptional 1.2% |
| Cambodians | 95.4 /100 | #106 | Exceptional 1.2% |
| Immigrants | West Indies | 95.3 /100 | #107 | Exceptional 1.2% |
| Iraqis | 95.1 /100 | #108 | Exceptional 1.2% |
| Immigrants | Panama | 95.0 /100 | #109 | Exceptional 1.2% |
| Immigrants | Lebanon | 95.0 /100 | #110 | Exceptional 1.2% |
| Senegalese | 94.6 /100 | #111 | Exceptional 1.2% |
Demographics Similar to Immigrants from Denmark by Disability Age Under 5
In terms of disability age under 5, the demographic groups most similar to Immigrants from Denmark are West Indian (1.1%, a difference of 0.12%), Immigrants from Burma/Myanmar (1.1%, a difference of 0.14%), Hmong (1.1%, a difference of 0.14%), Immigrants from Trinidad and Tobago (1.1%, a difference of 0.16%), and Turkish (1.1%, a difference of 0.18%).
| Demographics | Rating | Rank | Disability Age Under 5 |
| Immigrants | Ecuador | 98.6 /100 | #70 | Exceptional 1.1% |
| Trinidadians and Tobagonians | 98.6 /100 | #71 | Exceptional 1.1% |
| Burmese | 98.5 /100 | #72 | Exceptional 1.1% |
| Immigrants | Sri Lanka | 98.5 /100 | #73 | Exceptional 1.1% |
| Jordanians | 98.5 /100 | #74 | Exceptional 1.1% |
| Immigrants | Pakistan | 98.4 /100 | #75 | Exceptional 1.1% |
| Immigrants | Burma/Myanmar | 98.2 /100 | #76 | Exceptional 1.1% |
| Immigrants | Denmark | 98.1 /100 | #77 | Exceptional 1.1% |
| West Indians | 98.0 /100 | #78 | Exceptional 1.1% |
| Hmong | 98.0 /100 | #79 | Exceptional 1.1% |
| Immigrants | Trinidad and Tobago | 98.0 /100 | #80 | Exceptional 1.1% |
| Turks | 98.0 /100 | #81 | Exceptional 1.1% |
| Immigrants | Jordan | 97.9 /100 | #82 | Exceptional 1.1% |
| Immigrants | Syria | 97.9 /100 | #83 | Exceptional 1.1% |
| Immigrants | Zaire | 97.8 /100 | #84 | Exceptional 1.1% |