Immigrants from Hungary vs Immigrants from Denmark Disability Age Under 5
COMPARE
Immigrants from Hungary
Immigrants from Denmark
Disability Age Under 5
Disability Age Under 5 Comparison
Immigrants from Hungary
Immigrants from Denmark
1.4%
DISABILITY AGE UNDER 5
1.0/ 100
METRIC RATING
251st/ 347
METRIC RANK
1.1%
DISABILITY AGE UNDER 5
98.1/ 100
METRIC RATING
77th/ 347
METRIC RANK
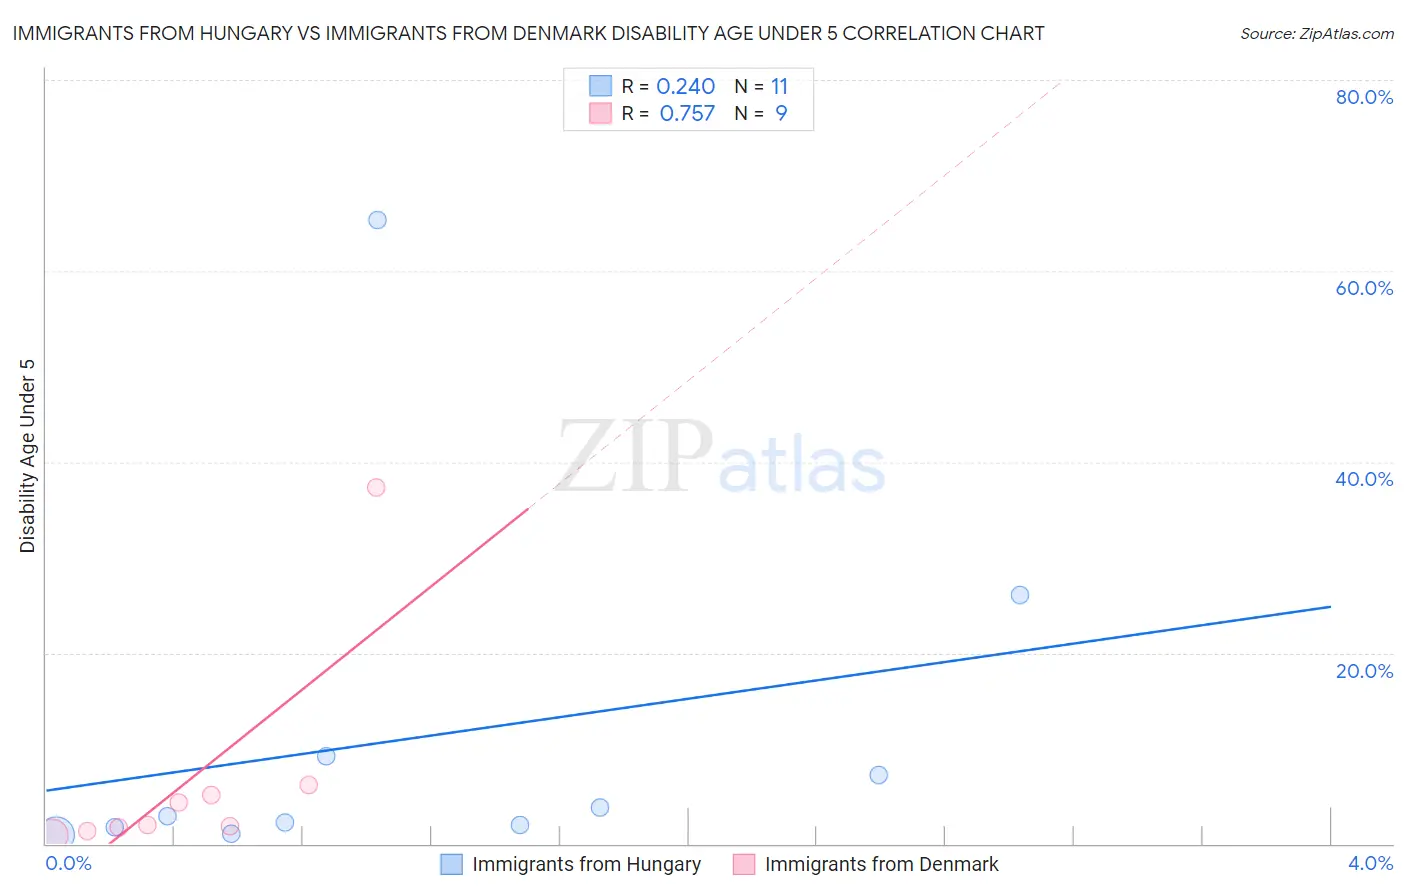
Immigrants from Hungary vs Immigrants from Denmark Disability Age Under 5 Correlation Chart
The statistical analysis conducted on geographies consisting of 126,295,139 people shows a weak positive correlation between the proportion of Immigrants from Hungary and percentage of population with a disability under the age of 5 in the United States with a correlation coefficient (R) of 0.240 and weighted average of 1.4%. Similarly, the statistical analysis conducted on geographies consisting of 97,246,779 people shows a strong positive correlation between the proportion of Immigrants from Denmark and percentage of population with a disability under the age of 5 in the United States with a correlation coefficient (R) of 0.757 and weighted average of 1.1%, a difference of 21.3%.
Disability Age Under 5 Correlation Summary
| Measurement | Immigrants from Hungary | Immigrants from Denmark |
| Minimum | 0.96% | 0.89% |
| Maximum | 65.4% | 37.3% |
| Range | 64.4% | 36.4% |
| Mean | 11.1% | 6.7% |
| Median | 2.9% | 1.9% |
| Interquartile 25% (IQ1) | 1.8% | 1.5% |
| Interquartile 75% (IQ3) | 9.2% | 5.7% |
| Interquartile Range (IQR) | 7.4% | 4.1% |
| Standard Deviation (Sample) | 19.4% | 11.6% |
| Standard Deviation (Population) | 18.5% | 10.9% |
Similar Demographics by Disability Age Under 5
Demographics Similar to Immigrants from Hungary by Disability Age Under 5
In terms of disability age under 5, the demographic groups most similar to Immigrants from Hungary are African (1.4%, a difference of 0.030%), Bermudan (1.4%, a difference of 0.040%), Immigrants from Scotland (1.4%, a difference of 0.040%), Eastern European (1.4%, a difference of 0.12%), and Immigrants from England (1.4%, a difference of 0.15%).
| Demographics | Rating | Rank | Disability Age Under 5 |
| Spaniards | 1.4 /100 | #244 | Tragic 1.4% |
| Potawatomi | 1.1 /100 | #245 | Tragic 1.4% |
| Russians | 1.0 /100 | #246 | Tragic 1.4% |
| Immigrants | England | 1.0 /100 | #247 | Tragic 1.4% |
| Eastern Europeans | 1.0 /100 | #248 | Tragic 1.4% |
| Bermudans | 1.0 /100 | #249 | Tragic 1.4% |
| Africans | 1.0 /100 | #250 | Tragic 1.4% |
| Immigrants | Hungary | 1.0 /100 | #251 | Tragic 1.4% |
| Immigrants | Scotland | 0.9 /100 | #252 | Tragic 1.4% |
| Australians | 0.7 /100 | #253 | Tragic 1.4% |
| Immigrants | Brazil | 0.7 /100 | #254 | Tragic 1.4% |
| Immigrants | Liberia | 0.6 /100 | #255 | Tragic 1.4% |
| Immigrants | Western Europe | 0.5 /100 | #256 | Tragic 1.4% |
| Slovenes | 0.3 /100 | #257 | Tragic 1.4% |
| Costa Ricans | 0.3 /100 | #258 | Tragic 1.4% |
Demographics Similar to Immigrants from Denmark by Disability Age Under 5
In terms of disability age under 5, the demographic groups most similar to Immigrants from Denmark are West Indian (1.1%, a difference of 0.12%), Immigrants from Burma/Myanmar (1.1%, a difference of 0.14%), Hmong (1.1%, a difference of 0.14%), Immigrants from Trinidad and Tobago (1.1%, a difference of 0.16%), and Turkish (1.1%, a difference of 0.18%).
| Demographics | Rating | Rank | Disability Age Under 5 |
| Immigrants | Ecuador | 98.6 /100 | #70 | Exceptional 1.1% |
| Trinidadians and Tobagonians | 98.6 /100 | #71 | Exceptional 1.1% |
| Burmese | 98.5 /100 | #72 | Exceptional 1.1% |
| Immigrants | Sri Lanka | 98.5 /100 | #73 | Exceptional 1.1% |
| Jordanians | 98.5 /100 | #74 | Exceptional 1.1% |
| Immigrants | Pakistan | 98.4 /100 | #75 | Exceptional 1.1% |
| Immigrants | Burma/Myanmar | 98.2 /100 | #76 | Exceptional 1.1% |
| Immigrants | Denmark | 98.1 /100 | #77 | Exceptional 1.1% |
| West Indians | 98.0 /100 | #78 | Exceptional 1.1% |
| Hmong | 98.0 /100 | #79 | Exceptional 1.1% |
| Immigrants | Trinidad and Tobago | 98.0 /100 | #80 | Exceptional 1.1% |
| Turks | 98.0 /100 | #81 | Exceptional 1.1% |
| Immigrants | Jordan | 97.9 /100 | #82 | Exceptional 1.1% |
| Immigrants | Syria | 97.9 /100 | #83 | Exceptional 1.1% |
| Immigrants | Zaire | 97.8 /100 | #84 | Exceptional 1.1% |