Honduran vs Immigrants from Guatemala Male Disability
COMPARE
Honduran
Immigrants from Guatemala
Male Disability
Male Disability Comparison
Hondurans
Immigrants from Guatemala
11.3%
MALE DISABILITY
41.1/ 100
METRIC RATING
180th/ 347
METRIC RANK
11.0%
MALE DISABILITY
75.1/ 100
METRIC RATING
150th/ 347
METRIC RANK
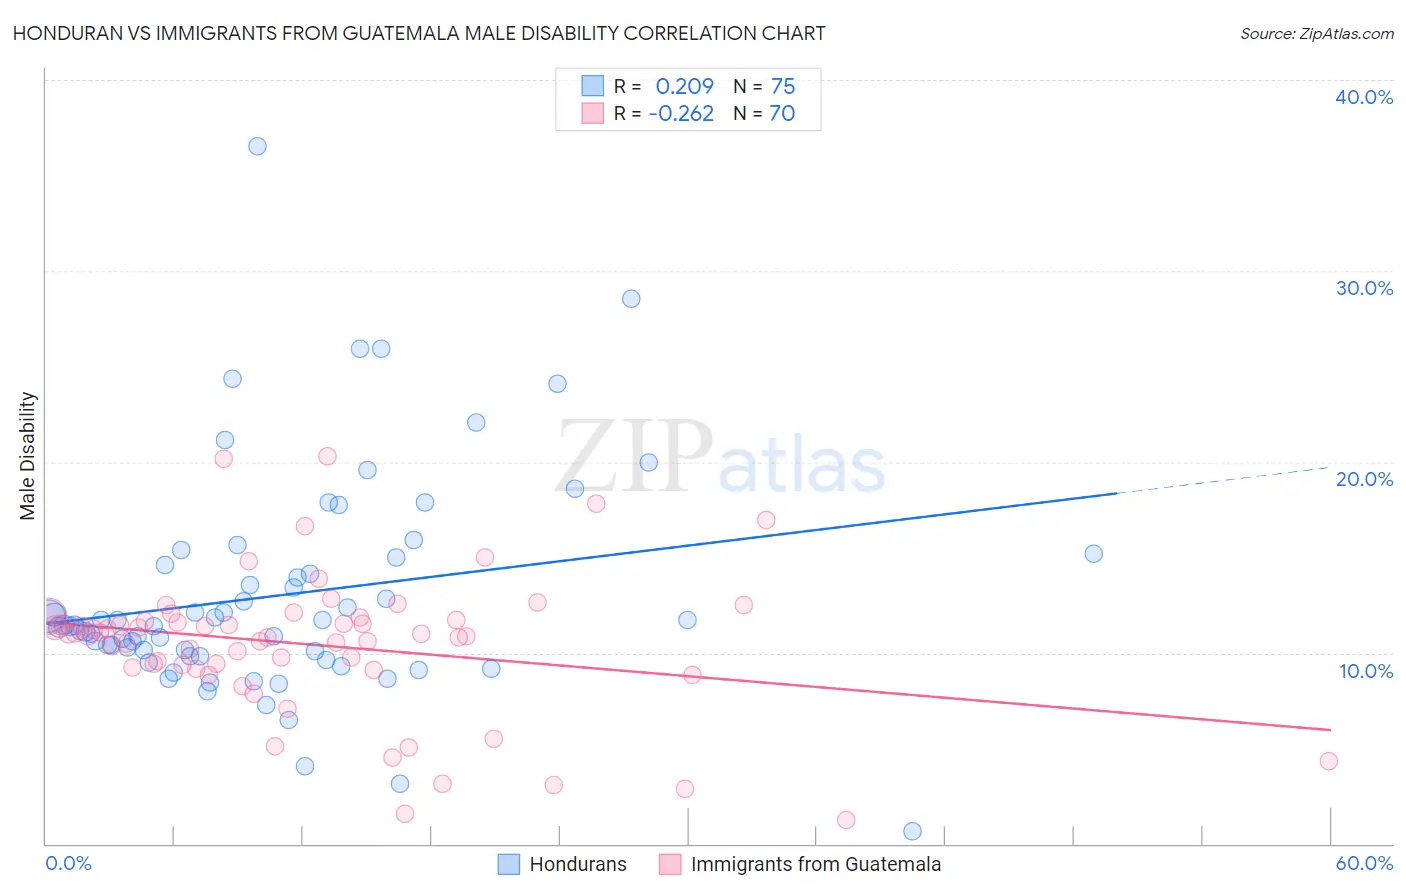
Honduran vs Immigrants from Guatemala Male Disability Correlation Chart
The statistical analysis conducted on geographies consisting of 357,765,878 people shows a weak positive correlation between the proportion of Hondurans and percentage of males with a disability in the United States with a correlation coefficient (R) of 0.209 and weighted average of 11.3%. Similarly, the statistical analysis conducted on geographies consisting of 377,223,661 people shows a weak negative correlation between the proportion of Immigrants from Guatemala and percentage of males with a disability in the United States with a correlation coefficient (R) of -0.262 and weighted average of 11.0%, a difference of 2.1%.
Male Disability Correlation Summary
| Measurement | Honduran | Immigrants from Guatemala |
| Minimum | 0.65% | 1.3% |
| Maximum | 36.5% | 20.3% |
| Range | 35.9% | 19.1% |
| Mean | 13.0% | 10.4% |
| Median | 11.4% | 10.9% |
| Interquartile 25% (IQ1) | 9.8% | 9.2% |
| Interquartile 75% (IQ3) | 15.0% | 11.7% |
| Interquartile Range (IQR) | 5.1% | 2.5% |
| Standard Deviation (Sample) | 5.8% | 3.7% |
| Standard Deviation (Population) | 5.8% | 3.7% |
Similar Demographics by Male Disability
Demographics Similar to Hondurans by Male Disability
In terms of male disability, the demographic groups most similar to Hondurans are Immigrants from Caribbean (11.3%, a difference of 0.020%), Australian (11.3%, a difference of 0.060%), Immigrants from Norway (11.3%, a difference of 0.17%), Syrian (11.2%, a difference of 0.31%), and Immigrants from Senegal (11.3%, a difference of 0.40%).
| Demographics | Rating | Rank | Male Disability |
| Immigrants | Burma/Myanmar | 50.4 /100 | #173 | Average 11.2% |
| Maltese | 50.0 /100 | #174 | Average 11.2% |
| Immigrants | Honduras | 48.7 /100 | #175 | Average 11.2% |
| Syrians | 46.6 /100 | #176 | Average 11.2% |
| Immigrants | Norway | 44.2 /100 | #177 | Average 11.3% |
| Australians | 42.2 /100 | #178 | Average 11.3% |
| Immigrants | Caribbean | 41.4 /100 | #179 | Average 11.3% |
| Hondurans | 41.1 /100 | #180 | Average 11.3% |
| Immigrants | Senegal | 34.4 /100 | #181 | Fair 11.3% |
| Immigrants | Belize | 33.7 /100 | #182 | Fair 11.3% |
| Immigrants | Central America | 32.9 /100 | #183 | Fair 11.3% |
| Iraqis | 30.5 /100 | #184 | Fair 11.3% |
| Pakistanis | 30.3 /100 | #185 | Fair 11.3% |
| Immigrants | Zaire | 27.6 /100 | #186 | Fair 11.4% |
| Immigrants | Austria | 27.3 /100 | #187 | Fair 11.4% |
Demographics Similar to Immigrants from Guatemala by Male Disability
In terms of male disability, the demographic groups most similar to Immigrants from Guatemala are Cuban (11.0%, a difference of 0.020%), Immigrants from Albania (11.0%, a difference of 0.050%), Immigrants from Denmark (11.0%, a difference of 0.10%), Immigrants from Northern Europe (11.1%, a difference of 0.14%), and Sudanese (11.0%, a difference of 0.15%).
| Demographics | Rating | Rank | Male Disability |
| Moroccans | 80.7 /100 | #143 | Excellent 11.0% |
| Kenyans | 78.1 /100 | #144 | Good 11.0% |
| Costa Ricans | 78.0 /100 | #145 | Good 11.0% |
| Koreans | 77.5 /100 | #146 | Good 11.0% |
| Immigrants | Croatia | 77.3 /100 | #147 | Good 11.0% |
| Sudanese | 77.1 /100 | #148 | Good 11.0% |
| Immigrants | Denmark | 76.4 /100 | #149 | Good 11.0% |
| Immigrants | Guatemala | 75.1 /100 | #150 | Good 11.0% |
| Cubans | 74.9 /100 | #151 | Good 11.0% |
| Immigrants | Albania | 74.4 /100 | #152 | Good 11.0% |
| Immigrants | Northern Europe | 73.2 /100 | #153 | Good 11.1% |
| Immigrants | Moldova | 72.8 /100 | #154 | Good 11.1% |
| Immigrants | Middle Africa | 70.9 /100 | #155 | Good 11.1% |
| Russians | 69.8 /100 | #156 | Good 11.1% |
| Immigrants | Western Africa | 69.2 /100 | #157 | Good 11.1% |