Honduran vs Soviet Union 5th Grade
COMPARE
Honduran
Soviet Union
5th Grade
5th Grade Comparison
Hondurans
Soviet Union
95.6%
5TH GRADE
0.0/ 100
METRIC RATING
324th/ 347
METRIC RANK
97.5%
5TH GRADE
81.2/ 100
METRIC RATING
147th/ 347
METRIC RANK
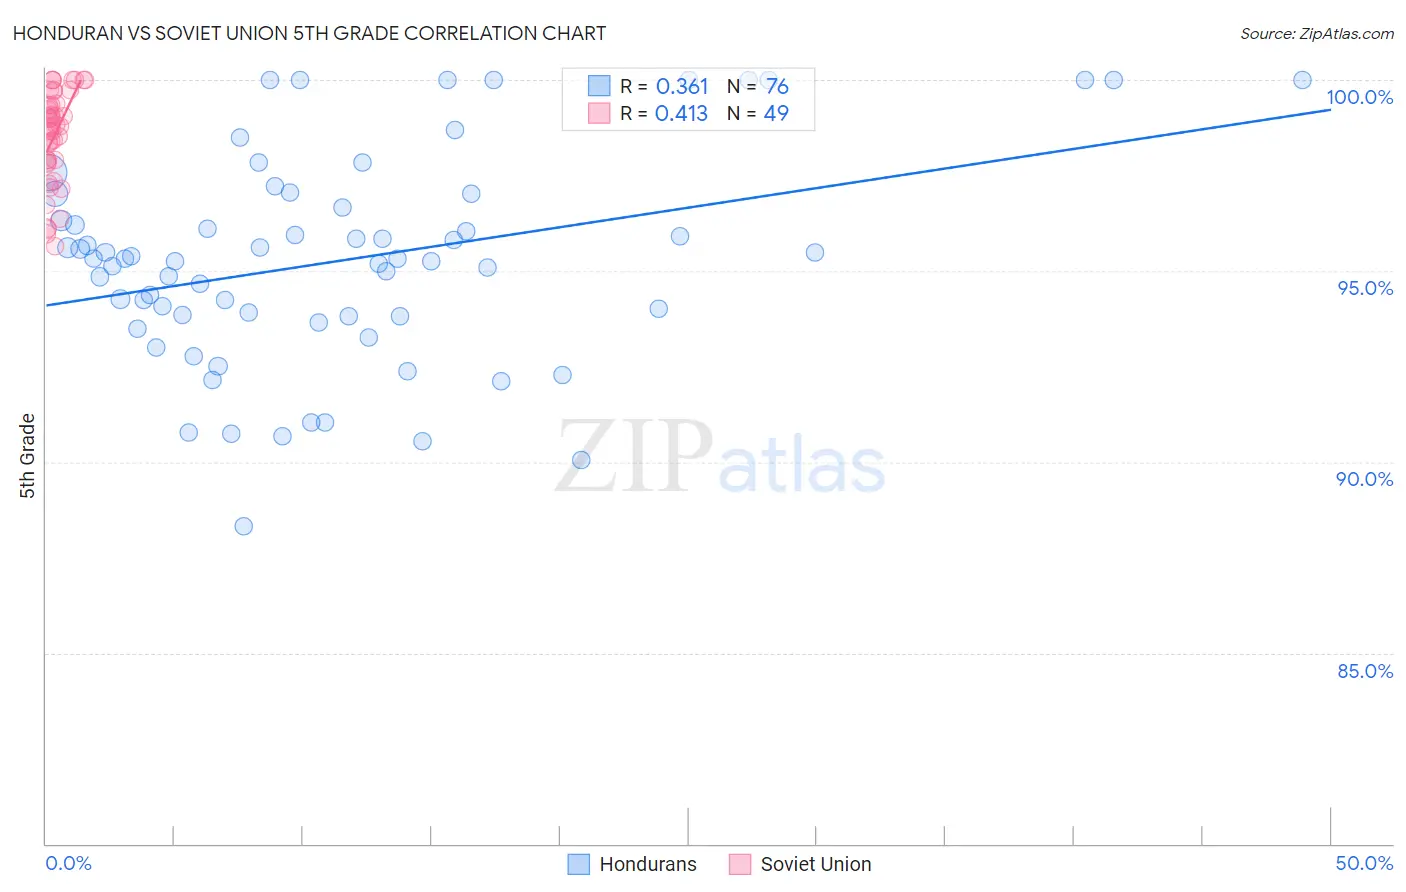
Honduran vs Soviet Union 5th Grade Correlation Chart
The statistical analysis conducted on geographies consisting of 357,784,803 people shows a mild positive correlation between the proportion of Hondurans and percentage of population with at least 5th grade education in the United States with a correlation coefficient (R) of 0.361 and weighted average of 95.6%. Similarly, the statistical analysis conducted on geographies consisting of 43,454,395 people shows a moderate positive correlation between the proportion of Soviet Union and percentage of population with at least 5th grade education in the United States with a correlation coefficient (R) of 0.413 and weighted average of 97.5%, a difference of 2.0%.
5th Grade Correlation Summary
| Measurement | Honduran | Soviet Union |
| Minimum | 88.3% | 95.7% |
| Maximum | 100.0% | 100.0% |
| Range | 11.7% | 4.3% |
| Mean | 95.3% | 98.5% |
| Median | 95.3% | 98.8% |
| Interquartile 25% (IQ1) | 93.8% | 97.9% |
| Interquartile 75% (IQ3) | 96.8% | 99.4% |
| Interquartile Range (IQR) | 3.0% | 1.5% |
| Standard Deviation (Sample) | 2.7% | 1.2% |
| Standard Deviation (Population) | 2.7% | 1.2% |
Similar Demographics by 5th Grade
Demographics Similar to Hondurans by 5th Grade
In terms of 5th grade, the demographic groups most similar to Hondurans are Hispanic or Latino (95.6%, a difference of 0.0%), Immigrants from Fiji (95.6%, a difference of 0.020%), Immigrants from Cambodia (95.5%, a difference of 0.030%), Dominican (95.5%, a difference of 0.030%), and Immigrants from Nicaragua (95.6%, a difference of 0.070%).
| Demographics | Rating | Rank | 5th Grade |
| Belizeans | 0.0 /100 | #317 | Tragic 95.8% |
| Immigrants | Vietnam | 0.0 /100 | #318 | Tragic 95.8% |
| Japanese | 0.0 /100 | #319 | Tragic 95.7% |
| Central American Indians | 0.0 /100 | #320 | Tragic 95.7% |
| Immigrants | Belize | 0.0 /100 | #321 | Tragic 95.7% |
| Immigrants | Nicaragua | 0.0 /100 | #322 | Tragic 95.6% |
| Immigrants | Fiji | 0.0 /100 | #323 | Tragic 95.6% |
| Hondurans | 0.0 /100 | #324 | Tragic 95.6% |
| Hispanics or Latinos | 0.0 /100 | #325 | Tragic 95.6% |
| Immigrants | Cambodia | 0.0 /100 | #326 | Tragic 95.5% |
| Dominicans | 0.0 /100 | #327 | Tragic 95.5% |
| Cape Verdeans | 0.0 /100 | #328 | Tragic 95.5% |
| Mexican American Indians | 0.0 /100 | #329 | Tragic 95.5% |
| Immigrants | Armenia | 0.0 /100 | #330 | Tragic 95.4% |
| Immigrants | Honduras | 0.0 /100 | #331 | Tragic 95.4% |
Demographics Similar to Soviet Union by 5th Grade
In terms of 5th grade, the demographic groups most similar to Soviet Union are Immigrants from Greece (97.5%, a difference of 0.010%), Jordanian (97.5%, a difference of 0.010%), Spaniard (97.5%, a difference of 0.010%), Immigrants from Israel (97.5%, a difference of 0.010%), and Hopi (97.5%, a difference of 0.020%).
| Demographics | Rating | Rank | 5th Grade |
| Burmese | 86.1 /100 | #140 | Excellent 97.5% |
| Seminole | 85.8 /100 | #141 | Excellent 97.5% |
| Israelis | 85.5 /100 | #142 | Excellent 97.5% |
| Immigrants | North Macedonia | 85.4 /100 | #143 | Excellent 97.5% |
| Immigrants | Greece | 83.2 /100 | #144 | Excellent 97.5% |
| Jordanians | 82.6 /100 | #145 | Excellent 97.5% |
| Spaniards | 81.9 /100 | #146 | Excellent 97.5% |
| Soviet Union | 81.2 /100 | #147 | Excellent 97.5% |
| Immigrants | Israel | 79.1 /100 | #148 | Good 97.5% |
| Hopi | 78.6 /100 | #149 | Good 97.5% |
| Immigrants | South Central Asia | 78.6 /100 | #150 | Good 97.5% |
| Immigrants | Eastern Europe | 75.0 /100 | #151 | Good 97.4% |
| Ute | 74.9 /100 | #152 | Good 97.4% |
| Alsatians | 74.3 /100 | #153 | Good 97.4% |
| Immigrants | Russia | 71.2 /100 | #154 | Good 97.4% |