Hmong vs Immigrants from Eastern Europe Female Disability
COMPARE
Hmong
Immigrants from Eastern Europe
Female Disability
Female Disability Comparison
Hmong
Immigrants from Eastern Europe
13.1%
FEMALE DISABILITY
0.0/ 100
METRIC RATING
284th/ 347
METRIC RANK
11.8%
FEMALE DISABILITY
97.2/ 100
METRIC RATING
117th/ 347
METRIC RANK
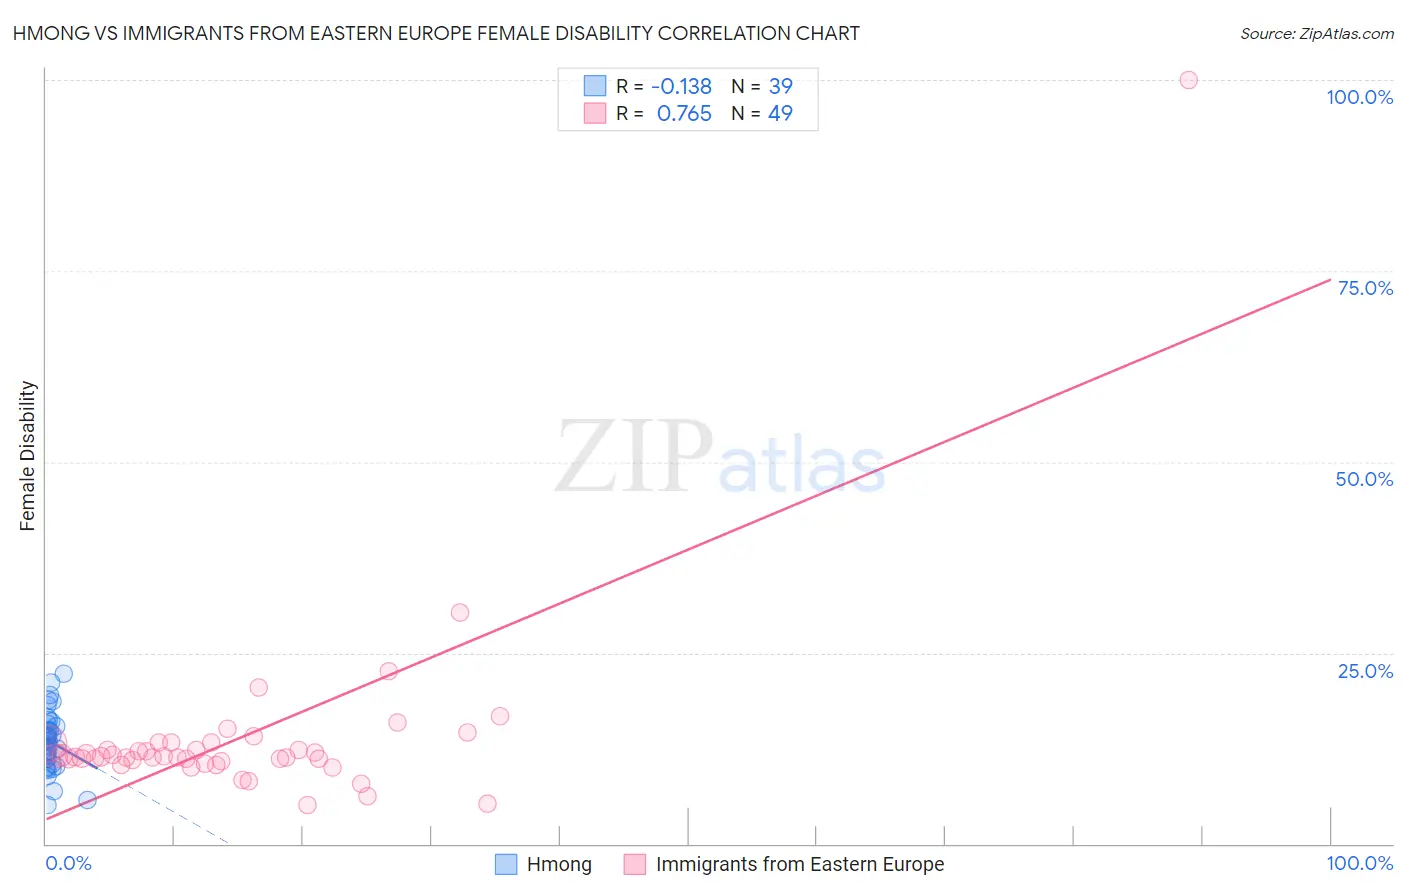
Hmong vs Immigrants from Eastern Europe Female Disability Correlation Chart
The statistical analysis conducted on geographies consisting of 24,681,034 people shows a poor negative correlation between the proportion of Hmong and percentage of females with a disability in the United States with a correlation coefficient (R) of -0.138 and weighted average of 13.1%. Similarly, the statistical analysis conducted on geographies consisting of 475,778,439 people shows a strong positive correlation between the proportion of Immigrants from Eastern Europe and percentage of females with a disability in the United States with a correlation coefficient (R) of 0.765 and weighted average of 11.8%, a difference of 11.0%.
Female Disability Correlation Summary
| Measurement | Hmong | Immigrants from Eastern Europe |
| Minimum | 5.1% | 5.1% |
| Maximum | 22.2% | 100.0% |
| Range | 17.1% | 94.9% |
| Mean | 13.3% | 13.9% |
| Median | 13.5% | 11.4% |
| Interquartile 25% (IQ1) | 10.5% | 10.9% |
| Interquartile 75% (IQ3) | 15.8% | 13.2% |
| Interquartile Range (IQR) | 5.2% | 2.3% |
| Standard Deviation (Sample) | 3.9% | 13.2% |
| Standard Deviation (Population) | 3.8% | 13.1% |
Similar Demographics by Female Disability
Demographics Similar to Hmong by Female Disability
In terms of female disability, the demographic groups most similar to Hmong are Bangladeshi (13.1%, a difference of 0.050%), Fijian (13.1%, a difference of 0.10%), English (13.1%, a difference of 0.13%), Welsh (13.1%, a difference of 0.14%), and U.S. Virgin Islander (13.1%, a difference of 0.22%).
| Demographics | Rating | Rank | Female Disability |
| Spanish | 0.1 /100 | #277 | Tragic 13.0% |
| Scottish | 0.1 /100 | #278 | Tragic 13.0% |
| Arapaho | 0.1 /100 | #279 | Tragic 13.0% |
| Irish | 0.1 /100 | #280 | Tragic 13.1% |
| U.S. Virgin Islanders | 0.1 /100 | #281 | Tragic 13.1% |
| Welsh | 0.0 /100 | #282 | Tragic 13.1% |
| English | 0.0 /100 | #283 | Tragic 13.1% |
| Hmong | 0.0 /100 | #284 | Tragic 13.1% |
| Bangladeshis | 0.0 /100 | #285 | Tragic 13.1% |
| Fijians | 0.0 /100 | #286 | Tragic 13.1% |
| Yaqui | 0.0 /100 | #287 | Tragic 13.2% |
| Whites/Caucasians | 0.0 /100 | #288 | Tragic 13.2% |
| Tlingit-Haida | 0.0 /100 | #289 | Tragic 13.2% |
| Immigrants | Yemen | 0.0 /100 | #290 | Tragic 13.2% |
| Shoshone | 0.0 /100 | #291 | Tragic 13.2% |
Demographics Similar to Immigrants from Eastern Europe by Female Disability
In terms of female disability, the demographic groups most similar to Immigrants from Eastern Europe are Immigrants from Nigeria (11.8%, a difference of 0.0%), Immigrants from Uganda (11.8%, a difference of 0.010%), Immigrants from Kazakhstan (11.8%, a difference of 0.090%), Immigrants from Netherlands (11.8%, a difference of 0.11%), and Immigrants from North Macedonia (11.8%, a difference of 0.12%).
| Demographics | Rating | Rank | Female Disability |
| Soviet Union | 98.1 /100 | #110 | Exceptional 11.7% |
| Costa Ricans | 98.1 /100 | #111 | Exceptional 11.7% |
| Immigrants | Bangladesh | 97.8 /100 | #112 | Exceptional 11.8% |
| Immigrants | Belarus | 97.8 /100 | #113 | Exceptional 11.8% |
| South Africans | 97.7 /100 | #114 | Exceptional 11.8% |
| Brazilians | 97.7 /100 | #115 | Exceptional 11.8% |
| Immigrants | Morocco | 97.6 /100 | #116 | Exceptional 11.8% |
| Immigrants | Eastern Europe | 97.2 /100 | #117 | Exceptional 11.8% |
| Immigrants | Nigeria | 97.2 /100 | #118 | Exceptional 11.8% |
| Immigrants | Uganda | 97.2 /100 | #119 | Exceptional 11.8% |
| Immigrants | Kazakhstan | 97.0 /100 | #120 | Exceptional 11.8% |
| Immigrants | Netherlands | 96.9 /100 | #121 | Exceptional 11.8% |
| Immigrants | North Macedonia | 96.8 /100 | #122 | Exceptional 11.8% |
| Immigrants | Croatia | 96.7 /100 | #123 | Exceptional 11.8% |
| Russians | 96.5 /100 | #124 | Exceptional 11.8% |