Hmong vs Immigrants from Jordan Child Poverty Under the Age of 5
COMPARE
Hmong
Immigrants from Jordan
Child Poverty Under the Age of 5
Child Poverty Under the Age of 5 Comparison
Hmong
Immigrants from Jordan
18.5%
CHILD POVERTY UNDER THE AGE OF 5
5.0/ 100
METRIC RATING
216th/ 347
METRIC RANK
16.1%
CHILD POVERTY UNDER THE AGE OF 5
93.2/ 100
METRIC RATING
119th/ 347
METRIC RANK
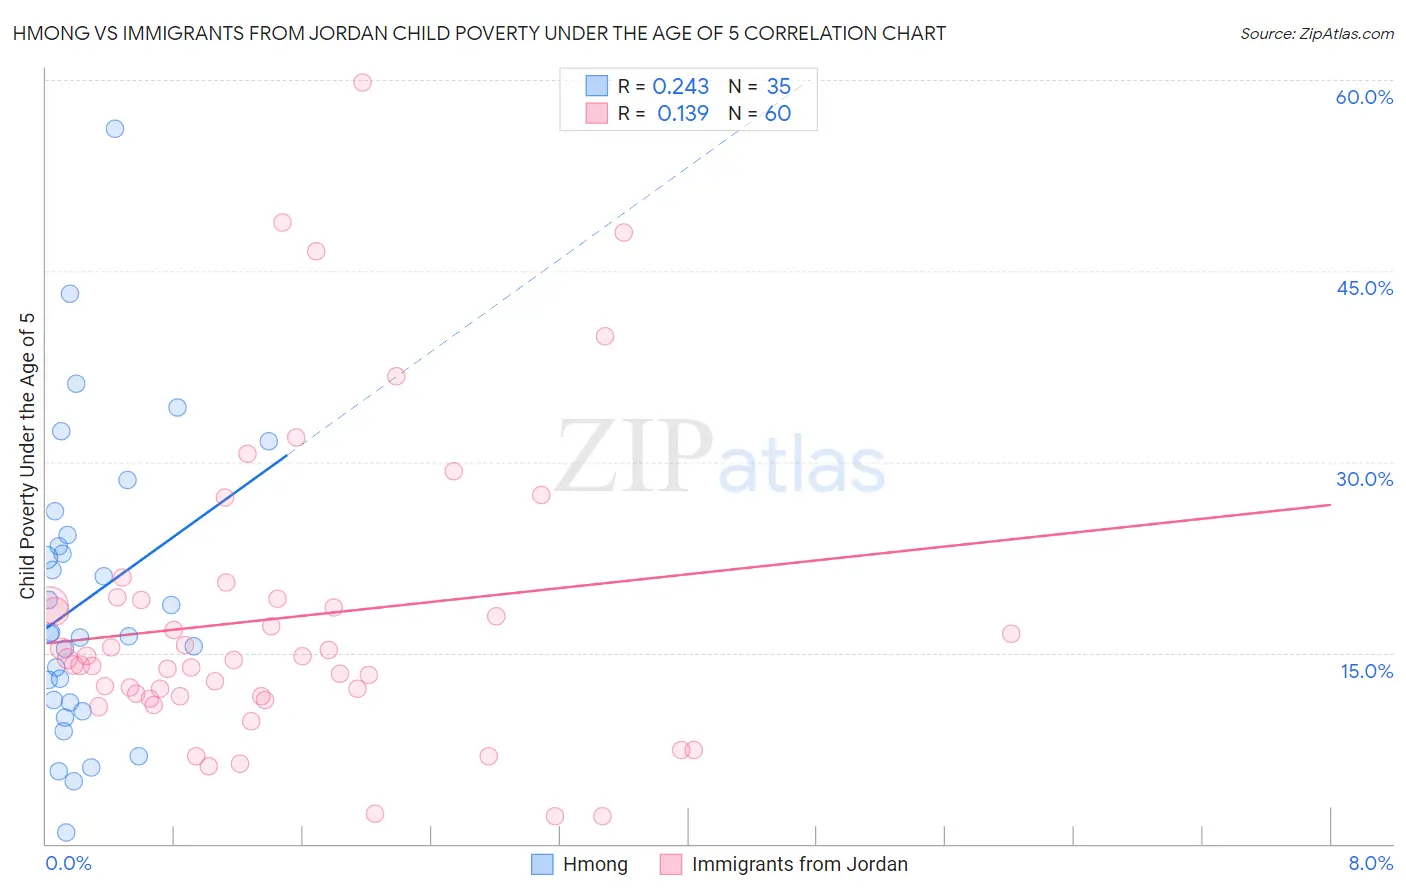
Hmong vs Immigrants from Jordan Child Poverty Under the Age of 5 Correlation Chart
The statistical analysis conducted on geographies consisting of 24,630,682 people shows a weak positive correlation between the proportion of Hmong and poverty level among children under the age of 5 in the United States with a correlation coefficient (R) of 0.243 and weighted average of 18.5%. Similarly, the statistical analysis conducted on geographies consisting of 178,163,363 people shows a poor positive correlation between the proportion of Immigrants from Jordan and poverty level among children under the age of 5 in the United States with a correlation coefficient (R) of 0.139 and weighted average of 16.1%, a difference of 15.5%.
Child Poverty Under the Age of 5 Correlation Summary
| Measurement | Hmong | Immigrants from Jordan |
| Minimum | 0.91% | 2.1% |
| Maximum | 56.2% | 59.8% |
| Range | 55.3% | 57.7% |
| Mean | 19.2% | 17.7% |
| Median | 16.5% | 14.5% |
| Interquartile 25% (IQ1) | 11.1% | 11.6% |
| Interquartile 75% (IQ3) | 24.2% | 19.2% |
| Interquartile Range (IQR) | 13.2% | 7.6% |
| Standard Deviation (Sample) | 11.6% | 11.8% |
| Standard Deviation (Population) | 11.5% | 11.7% |
Similar Demographics by Child Poverty Under the Age of 5
Demographics Similar to Hmong by Child Poverty Under the Age of 5
In terms of child poverty under the age of 5, the demographic groups most similar to Hmong are Immigrants from Africa (18.6%, a difference of 0.20%), Immigrants from Panama (18.5%, a difference of 0.46%), Malaysian (18.4%, a difference of 0.66%), Delaware (18.7%, a difference of 0.95%), and German Russian (18.8%, a difference of 1.3%).
| Demographics | Rating | Rank | Child Poverty Under the Age of 5 |
| Spanish | 9.8 /100 | #209 | Tragic 18.2% |
| Panamanians | 9.7 /100 | #210 | Tragic 18.2% |
| Moroccans | 9.4 /100 | #211 | Tragic 18.2% |
| Nepalese | 8.7 /100 | #212 | Tragic 18.3% |
| Immigrants | Thailand | 8.6 /100 | #213 | Tragic 18.3% |
| Malaysians | 6.5 /100 | #214 | Tragic 18.4% |
| Immigrants | Panama | 6.0 /100 | #215 | Tragic 18.5% |
| Hmong | 5.0 /100 | #216 | Tragic 18.5% |
| Immigrants | Africa | 4.6 /100 | #217 | Tragic 18.6% |
| Delaware | 3.4 /100 | #218 | Tragic 18.7% |
| German Russians | 3.0 /100 | #219 | Tragic 18.8% |
| Immigrants | Azores | 2.6 /100 | #220 | Tragic 18.9% |
| Immigrants | Nigeria | 2.1 /100 | #221 | Tragic 19.0% |
| Alsatians | 1.7 /100 | #222 | Tragic 19.1% |
| Cubans | 1.7 /100 | #223 | Tragic 19.1% |
Demographics Similar to Immigrants from Jordan by Child Poverty Under the Age of 5
In terms of child poverty under the age of 5, the demographic groups most similar to Immigrants from Jordan are Basque (16.0%, a difference of 0.11%), Immigrants from Denmark (16.0%, a difference of 0.11%), Immigrants from Austria (16.0%, a difference of 0.13%), Immigrants from Peru (16.1%, a difference of 0.26%), and Mongolian (16.1%, a difference of 0.27%).
| Demographics | Rating | Rank | Child Poverty Under the Age of 5 |
| Peruvians | 94.1 /100 | #112 | Exceptional 16.0% |
| Puget Sound Salish | 94.1 /100 | #113 | Exceptional 16.0% |
| Immigrants | Kuwait | 93.9 /100 | #114 | Exceptional 16.0% |
| Albanians | 93.8 /100 | #115 | Exceptional 16.0% |
| Immigrants | Austria | 93.5 /100 | #116 | Exceptional 16.0% |
| Basques | 93.4 /100 | #117 | Exceptional 16.0% |
| Immigrants | Denmark | 93.4 /100 | #118 | Exceptional 16.0% |
| Immigrants | Jordan | 93.2 /100 | #119 | Exceptional 16.1% |
| Immigrants | Peru | 92.6 /100 | #120 | Exceptional 16.1% |
| Mongolians | 92.5 /100 | #121 | Exceptional 16.1% |
| Immigrants | Southern Europe | 92.0 /100 | #122 | Exceptional 16.1% |
| Austrians | 92.0 /100 | #123 | Exceptional 16.1% |
| Swiss | 92.0 /100 | #124 | Exceptional 16.1% |
| Native Hawaiians | 91.8 /100 | #125 | Exceptional 16.2% |
| Immigrants | Albania | 91.8 /100 | #126 | Exceptional 16.2% |