Hmong vs Immigrants from Jordan Householder Income Ages 25 - 44 years
COMPARE
Hmong
Immigrants from Jordan
Householder Income Ages 25 - 44 years
Householder Income Ages 25 - 44 years Comparison
Hmong
Immigrants from Jordan
$84,258
HOUSEHOLDER INCOME AGES 25 - 44 YEARS
0.3/ 100
METRIC RATING
267th/ 347
METRIC RANK
$97,185
HOUSEHOLDER INCOME AGES 25 - 44 YEARS
81.0/ 100
METRIC RATING
143rd/ 347
METRIC RANK
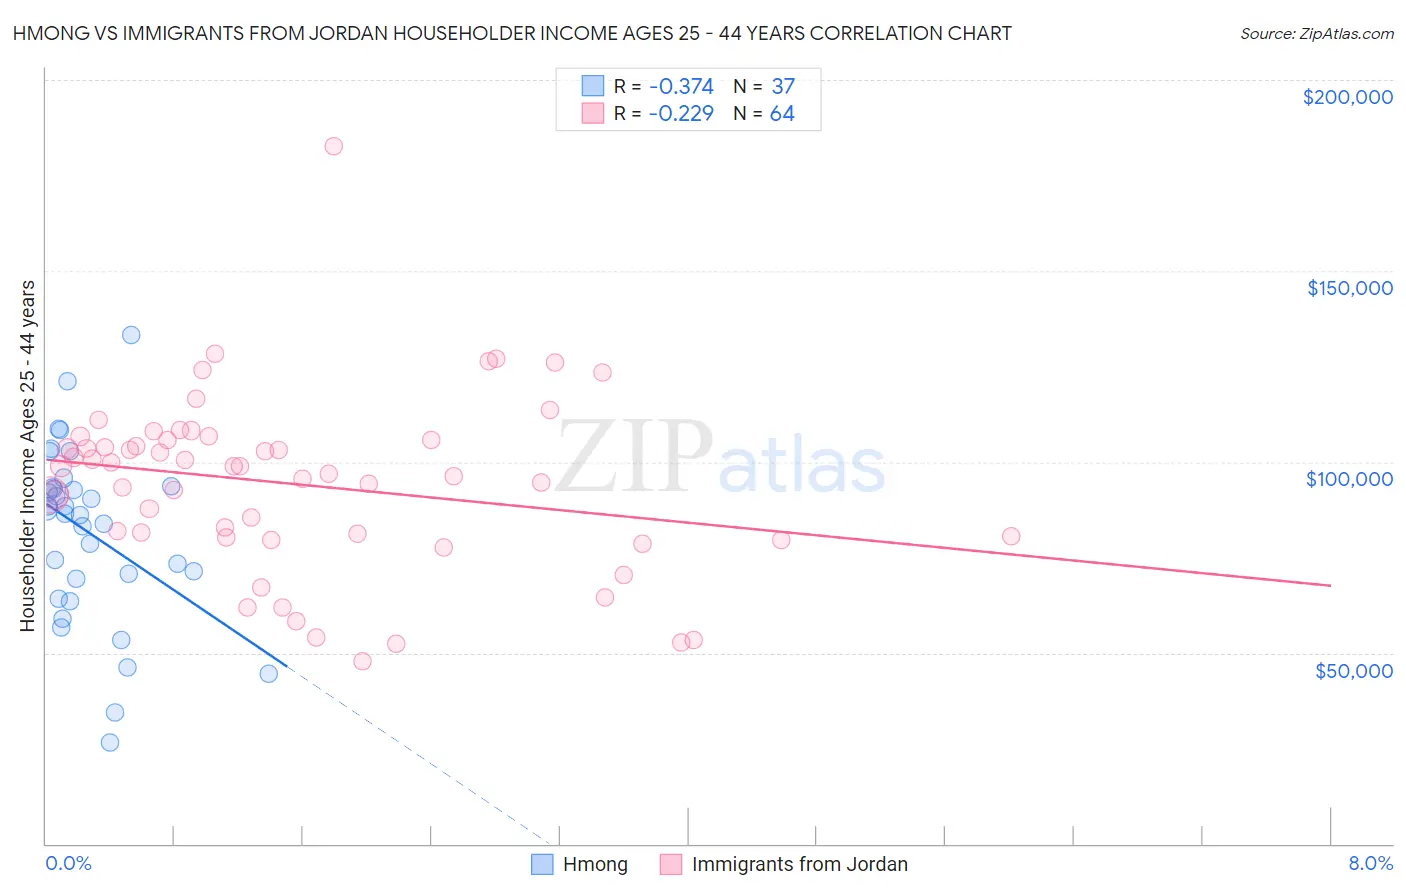
Hmong vs Immigrants from Jordan Householder Income Ages 25 - 44 years Correlation Chart
The statistical analysis conducted on geographies consisting of 24,651,789 people shows a mild negative correlation between the proportion of Hmong and household income with householder between the ages 25 and 44 in the United States with a correlation coefficient (R) of -0.374 and weighted average of $84,258. Similarly, the statistical analysis conducted on geographies consisting of 181,164,204 people shows a weak negative correlation between the proportion of Immigrants from Jordan and household income with householder between the ages 25 and 44 in the United States with a correlation coefficient (R) of -0.229 and weighted average of $97,185, a difference of 15.3%.
Householder Income Ages 25 - 44 years Correlation Summary
| Measurement | Hmong | Immigrants from Jordan |
| Minimum | $26,488 | $47,644 |
| Maximum | $133,083 | $182,512 |
| Range | $106,595 | $134,868 |
| Mean | $81,379 | $94,069 |
| Median | $86,301 | $97,769 |
| Interquartile 25% (IQ1) | $66,711 | $80,422 |
| Interquartile 75% (IQ3) | $93,560 | $105,721 |
| Interquartile Range (IQR) | $26,850 | $25,299 |
| Standard Deviation (Sample) | $23,085 | $23,095 |
| Standard Deviation (Population) | $22,771 | $22,914 |
Similar Demographics by Householder Income Ages 25 - 44 years
Demographics Similar to Hmong by Householder Income Ages 25 - 44 years
In terms of householder income ages 25 - 44 years, the demographic groups most similar to Hmong are Subsaharan African ($84,235, a difference of 0.030%), Immigrants from Cabo Verde ($84,304, a difference of 0.050%), Sudanese ($84,401, a difference of 0.17%), Spanish American Indian ($84,085, a difference of 0.21%), and Osage ($84,461, a difference of 0.24%).
| Demographics | Rating | Rank | Householder Income Ages 25 - 44 years |
| Americans | 0.4 /100 | #260 | Tragic $84,791 |
| Inupiat | 0.4 /100 | #261 | Tragic $84,619 |
| Cree | 0.4 /100 | #262 | Tragic $84,574 |
| Belizeans | 0.4 /100 | #263 | Tragic $84,534 |
| Osage | 0.4 /100 | #264 | Tragic $84,461 |
| Sudanese | 0.4 /100 | #265 | Tragic $84,401 |
| Immigrants | Cabo Verde | 0.3 /100 | #266 | Tragic $84,304 |
| Hmong | 0.3 /100 | #267 | Tragic $84,258 |
| Sub-Saharan Africans | 0.3 /100 | #268 | Tragic $84,235 |
| Spanish American Indians | 0.3 /100 | #269 | Tragic $84,085 |
| Jamaicans | 0.3 /100 | #270 | Tragic $83,933 |
| Somalis | 0.2 /100 | #271 | Tragic $83,752 |
| Spanish Americans | 0.2 /100 | #272 | Tragic $83,722 |
| Iroquois | 0.2 /100 | #273 | Tragic $83,682 |
| Marshallese | 0.2 /100 | #274 | Tragic $83,575 |
Demographics Similar to Immigrants from Jordan by Householder Income Ages 25 - 44 years
In terms of householder income ages 25 - 44 years, the demographic groups most similar to Immigrants from Jordan are Immigrants from Chile ($97,159, a difference of 0.030%), Danish ($97,221, a difference of 0.040%), Luxembourger ($97,237, a difference of 0.050%), Immigrants from Morocco ($97,305, a difference of 0.12%), and Immigrants from Peru ($97,329, a difference of 0.15%).
| Demographics | Rating | Rank | Householder Income Ages 25 - 44 years |
| Hungarians | 83.9 /100 | #136 | Excellent $97,544 |
| Lebanese | 82.3 /100 | #137 | Excellent $97,339 |
| Arabs | 82.3 /100 | #138 | Excellent $97,336 |
| Immigrants | Peru | 82.2 /100 | #139 | Excellent $97,329 |
| Immigrants | Morocco | 82.0 /100 | #140 | Excellent $97,305 |
| Luxembourgers | 81.5 /100 | #141 | Excellent $97,237 |
| Danes | 81.3 /100 | #142 | Excellent $97,221 |
| Immigrants | Jordan | 81.0 /100 | #143 | Excellent $97,185 |
| Immigrants | Chile | 80.8 /100 | #144 | Excellent $97,159 |
| Norwegians | 78.2 /100 | #145 | Good $96,866 |
| Ethiopians | 77.8 /100 | #146 | Good $96,824 |
| Immigrants | Syria | 77.4 /100 | #147 | Good $96,789 |
| Irish | 76.9 /100 | #148 | Good $96,730 |
| Basques | 76.6 /100 | #149 | Good $96,709 |
| Ugandans | 76.2 /100 | #150 | Good $96,667 |