Hmong vs Moroccan Female Disability
COMPARE
Hmong
Moroccan
Female Disability
Female Disability Comparison
Hmong
Moroccans
13.1%
FEMALE DISABILITY
0.0/ 100
METRIC RATING
284th/ 347
METRIC RANK
12.1%
FEMALE DISABILITY
72.9/ 100
METRIC RATING
156th/ 347
METRIC RANK
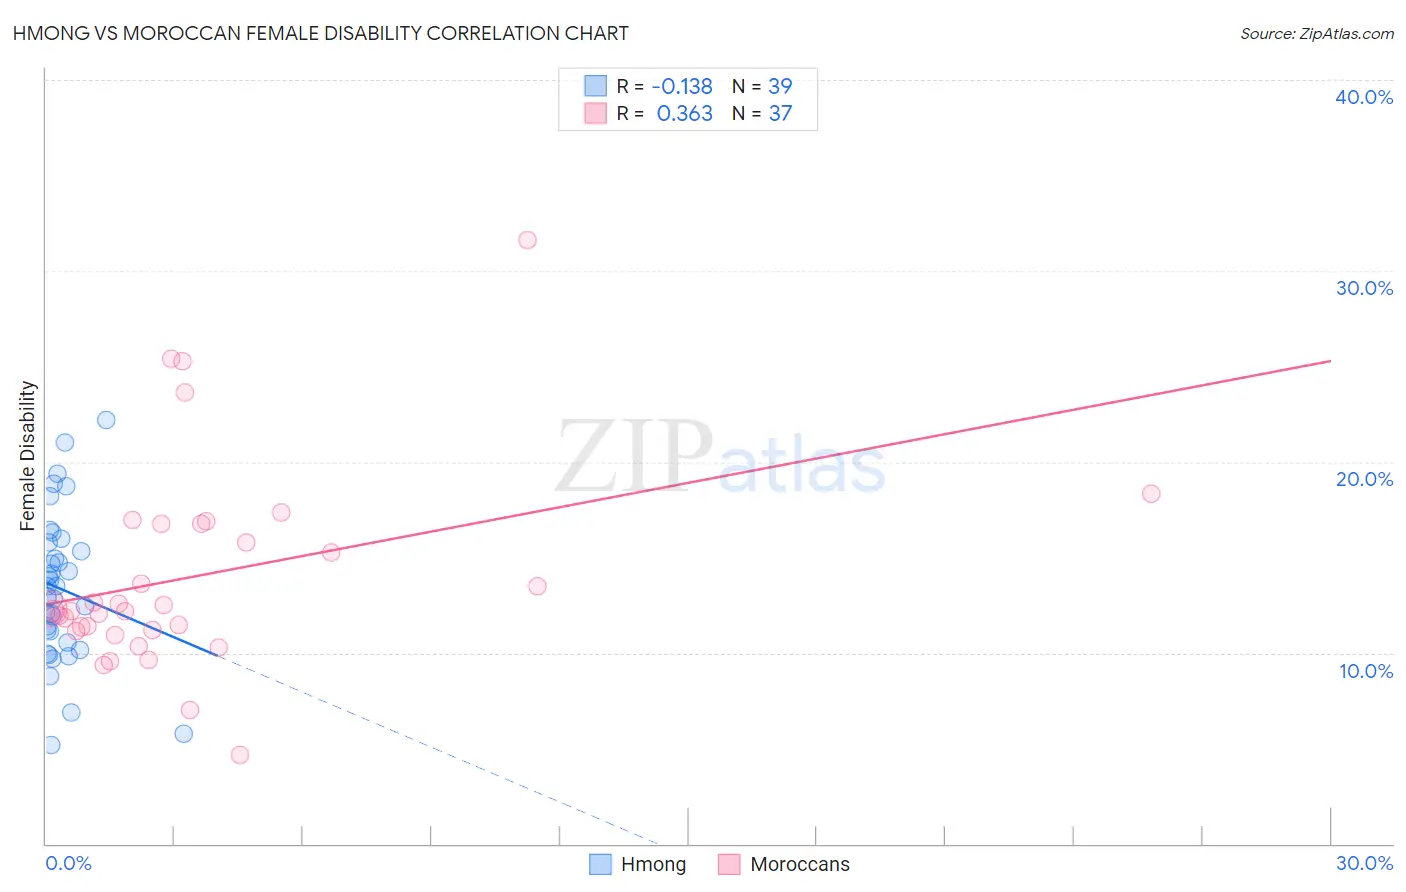
Hmong vs Moroccan Female Disability Correlation Chart
The statistical analysis conducted on geographies consisting of 24,681,034 people shows a poor negative correlation between the proportion of Hmong and percentage of females with a disability in the United States with a correlation coefficient (R) of -0.138 and weighted average of 13.1%. Similarly, the statistical analysis conducted on geographies consisting of 201,802,269 people shows a mild positive correlation between the proportion of Moroccans and percentage of females with a disability in the United States with a correlation coefficient (R) of 0.363 and weighted average of 12.1%, a difference of 8.3%.
Female Disability Correlation Summary
| Measurement | Hmong | Moroccan |
| Minimum | 5.1% | 4.6% |
| Maximum | 22.2% | 31.6% |
| Range | 17.1% | 27.0% |
| Mean | 13.3% | 14.0% |
| Median | 13.5% | 12.2% |
| Interquartile 25% (IQ1) | 10.5% | 11.2% |
| Interquartile 75% (IQ3) | 15.8% | 16.8% |
| Interquartile Range (IQR) | 5.2% | 5.6% |
| Standard Deviation (Sample) | 3.9% | 5.3% |
| Standard Deviation (Population) | 3.8% | 5.3% |
Similar Demographics by Female Disability
Demographics Similar to Hmong by Female Disability
In terms of female disability, the demographic groups most similar to Hmong are Bangladeshi (13.1%, a difference of 0.050%), Fijian (13.1%, a difference of 0.10%), English (13.1%, a difference of 0.13%), Welsh (13.1%, a difference of 0.14%), and U.S. Virgin Islander (13.1%, a difference of 0.22%).
| Demographics | Rating | Rank | Female Disability |
| Spanish | 0.1 /100 | #277 | Tragic 13.0% |
| Scottish | 0.1 /100 | #278 | Tragic 13.0% |
| Arapaho | 0.1 /100 | #279 | Tragic 13.0% |
| Irish | 0.1 /100 | #280 | Tragic 13.1% |
| U.S. Virgin Islanders | 0.1 /100 | #281 | Tragic 13.1% |
| Welsh | 0.0 /100 | #282 | Tragic 13.1% |
| English | 0.0 /100 | #283 | Tragic 13.1% |
| Hmong | 0.0 /100 | #284 | Tragic 13.1% |
| Bangladeshis | 0.0 /100 | #285 | Tragic 13.1% |
| Fijians | 0.0 /100 | #286 | Tragic 13.1% |
| Yaqui | 0.0 /100 | #287 | Tragic 13.2% |
| Whites/Caucasians | 0.0 /100 | #288 | Tragic 13.2% |
| Tlingit-Haida | 0.0 /100 | #289 | Tragic 13.2% |
| Immigrants | Yemen | 0.0 /100 | #290 | Tragic 13.2% |
| Shoshone | 0.0 /100 | #291 | Tragic 13.2% |
Demographics Similar to Moroccans by Female Disability
In terms of female disability, the demographic groups most similar to Moroccans are Danish (12.1%, a difference of 0.020%), Immigrants from Middle Africa (12.1%, a difference of 0.020%), Ghanaian (12.1%, a difference of 0.19%), Syrian (12.1%, a difference of 0.20%), and Immigrants from Central America (12.1%, a difference of 0.24%).
| Demographics | Rating | Rank | Female Disability |
| Greeks | 82.0 /100 | #149 | Excellent 12.0% |
| Immigrants | Moldova | 81.4 /100 | #150 | Excellent 12.0% |
| Icelanders | 80.7 /100 | #151 | Excellent 12.0% |
| Immigrants | Scotland | 79.3 /100 | #152 | Good 12.0% |
| Sudanese | 79.1 /100 | #153 | Good 12.0% |
| Syrians | 76.9 /100 | #154 | Good 12.1% |
| Ghanaians | 76.6 /100 | #155 | Good 12.1% |
| Moroccans | 72.9 /100 | #156 | Good 12.1% |
| Danes | 72.5 /100 | #157 | Good 12.1% |
| Immigrants | Middle Africa | 72.4 /100 | #158 | Good 12.1% |
| Immigrants | Central America | 67.7 /100 | #159 | Good 12.1% |
| Immigrants | Guatemala | 66.0 /100 | #160 | Good 12.1% |
| Guyanese | 64.7 /100 | #161 | Good 12.1% |
| Immigrants | Ukraine | 64.3 /100 | #162 | Good 12.1% |
| Guatemalans | 63.8 /100 | #163 | Good 12.1% |