Hispanic or Latino vs Ute Self-Care Disability
COMPARE
Hispanic or Latino
Ute
Self-Care Disability
Self-Care Disability Comparison
Hispanics or Latinos
Ute
2.7%
SELF-CARE DISABILITY
0.1/ 100
METRIC RATING
280th/ 347
METRIC RANK
2.5%
SELF-CARE DISABILITY
57.1/ 100
METRIC RATING
168th/ 347
METRIC RANK
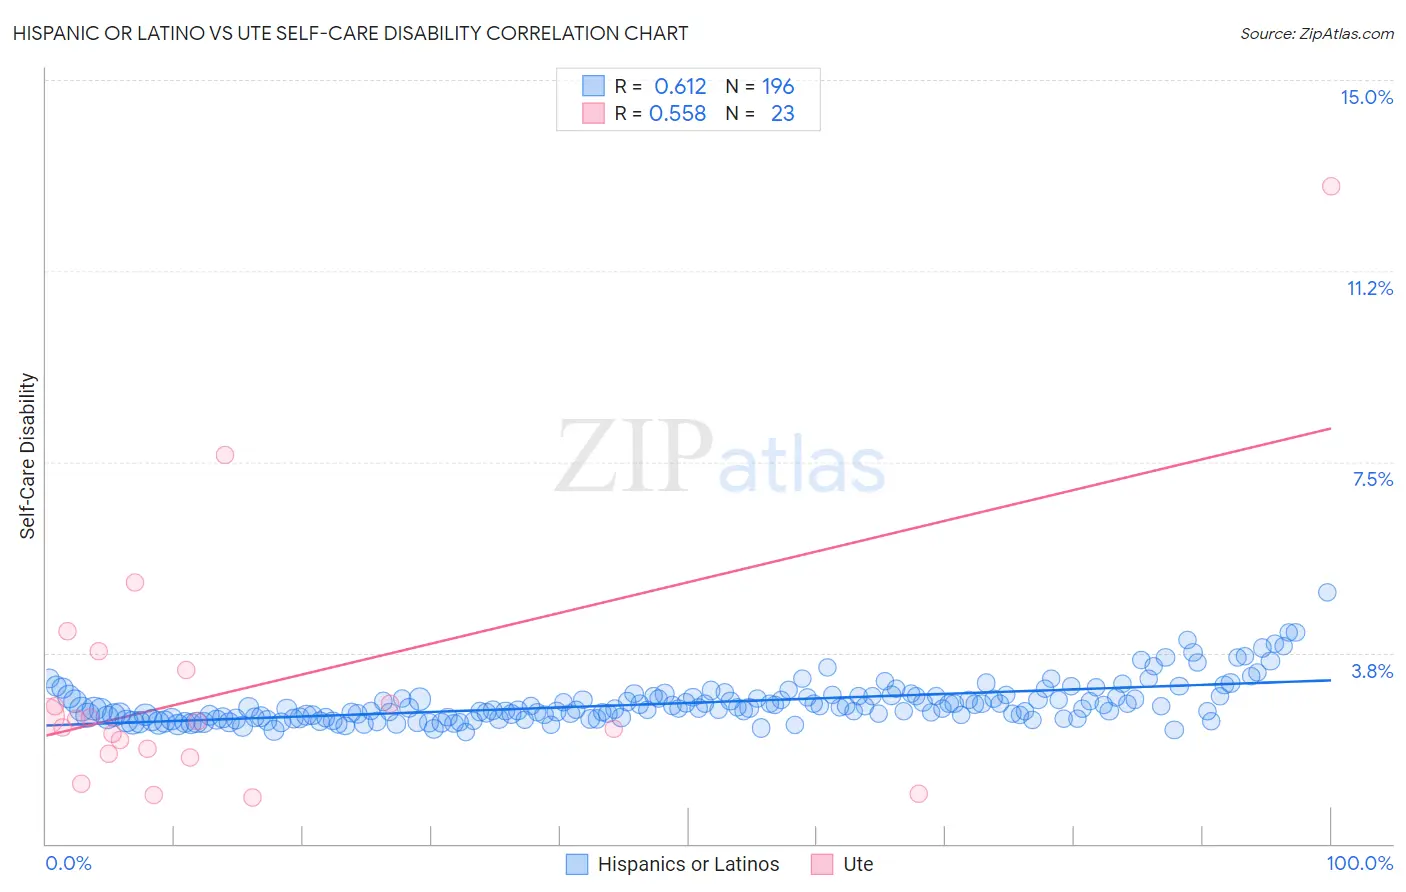
Hispanic or Latino vs Ute Self-Care Disability Correlation Chart
The statistical analysis conducted on geographies consisting of 571,452,222 people shows a significant positive correlation between the proportion of Hispanics or Latinos and percentage of population with self-care disability in the United States with a correlation coefficient (R) of 0.612 and weighted average of 2.7%. Similarly, the statistical analysis conducted on geographies consisting of 55,649,381 people shows a substantial positive correlation between the proportion of Ute and percentage of population with self-care disability in the United States with a correlation coefficient (R) of 0.558 and weighted average of 2.5%, a difference of 9.4%.
Self-Care Disability Correlation Summary
| Measurement | Hispanic or Latino | Ute |
| Minimum | 2.2% | 0.91% |
| Maximum | 4.9% | 12.9% |
| Range | 2.8% | 12.0% |
| Mean | 2.8% | 3.1% |
| Median | 2.7% | 2.4% |
| Interquartile 25% (IQ1) | 2.5% | 1.8% |
| Interquartile 75% (IQ3) | 2.9% | 3.4% |
| Interquartile Range (IQR) | 0.42% | 1.7% |
| Standard Deviation (Sample) | 0.41% | 2.6% |
| Standard Deviation (Population) | 0.41% | 2.6% |
Similar Demographics by Self-Care Disability
Demographics Similar to Hispanics or Latinos by Self-Care Disability
In terms of self-care disability, the demographic groups most similar to Hispanics or Latinos are Iroquois (2.7%, a difference of 0.020%), Ottawa (2.7%, a difference of 0.12%), Immigrants from Iraq (2.7%, a difference of 0.16%), Apache (2.7%, a difference of 0.17%), and Immigrants from Ukraine (2.7%, a difference of 0.20%).
| Demographics | Rating | Rank | Self-Care Disability |
| Mexicans | 0.1 /100 | #273 | Tragic 2.7% |
| Yakama | 0.1 /100 | #274 | Tragic 2.7% |
| Immigrants | Trinidad and Tobago | 0.1 /100 | #275 | Tragic 2.7% |
| Japanese | 0.1 /100 | #276 | Tragic 2.7% |
| Immigrants | Ukraine | 0.1 /100 | #277 | Tragic 2.7% |
| Ottawa | 0.1 /100 | #278 | Tragic 2.7% |
| Iroquois | 0.1 /100 | #279 | Tragic 2.7% |
| Hispanics or Latinos | 0.1 /100 | #280 | Tragic 2.7% |
| Immigrants | Iraq | 0.0 /100 | #281 | Tragic 2.7% |
| Apache | 0.0 /100 | #282 | Tragic 2.7% |
| Delaware | 0.0 /100 | #283 | Tragic 2.7% |
| Fijians | 0.0 /100 | #284 | Tragic 2.7% |
| Jamaicans | 0.0 /100 | #285 | Tragic 2.7% |
| French American Indians | 0.0 /100 | #286 | Tragic 2.7% |
| Immigrants | Jamaica | 0.0 /100 | #287 | Tragic 2.7% |
Demographics Similar to Ute by Self-Care Disability
In terms of self-care disability, the demographic groups most similar to Ute are Immigrants from Greece (2.5%, a difference of 0.010%), Immigrants from Somalia (2.5%, a difference of 0.060%), Canadian (2.5%, a difference of 0.080%), Syrian (2.5%, a difference of 0.090%), and Immigrants from Vietnam (2.5%, a difference of 0.11%).
| Demographics | Rating | Rank | Self-Care Disability |
| Lebanese | 66.5 /100 | #161 | Good 2.4% |
| Somalis | 63.7 /100 | #162 | Good 2.5% |
| German Russians | 62.7 /100 | #163 | Good 2.5% |
| Immigrants | Vietnam | 59.3 /100 | #164 | Average 2.5% |
| Syrians | 59.0 /100 | #165 | Average 2.5% |
| Canadians | 58.8 /100 | #166 | Average 2.5% |
| Immigrants | Greece | 57.3 /100 | #167 | Average 2.5% |
| Ute | 57.1 /100 | #168 | Average 2.5% |
| Immigrants | Somalia | 55.9 /100 | #169 | Average 2.5% |
| Scottish | 54.3 /100 | #170 | Average 2.5% |
| Pennsylvania Germans | 53.5 /100 | #171 | Average 2.5% |
| Czechoslovakians | 53.5 /100 | #172 | Average 2.5% |
| Immigrants | Burma/Myanmar | 52.8 /100 | #173 | Average 2.5% |
| Welsh | 50.0 /100 | #174 | Average 2.5% |
| Immigrants | Bosnia and Herzegovina | 49.6 /100 | #175 | Average 2.5% |