Nigerian vs Immigrants from Saudi Arabia Male Disability
COMPARE
Nigerian
Immigrants from Saudi Arabia
Male Disability
Male Disability Comparison
Nigerians
Immigrants from Saudi Arabia
11.0%
MALE DISABILITY
81.9/ 100
METRIC RATING
138th/ 347
METRIC RANK
10.4%
MALE DISABILITY
99.6/ 100
METRIC RATING
52nd/ 347
METRIC RANK
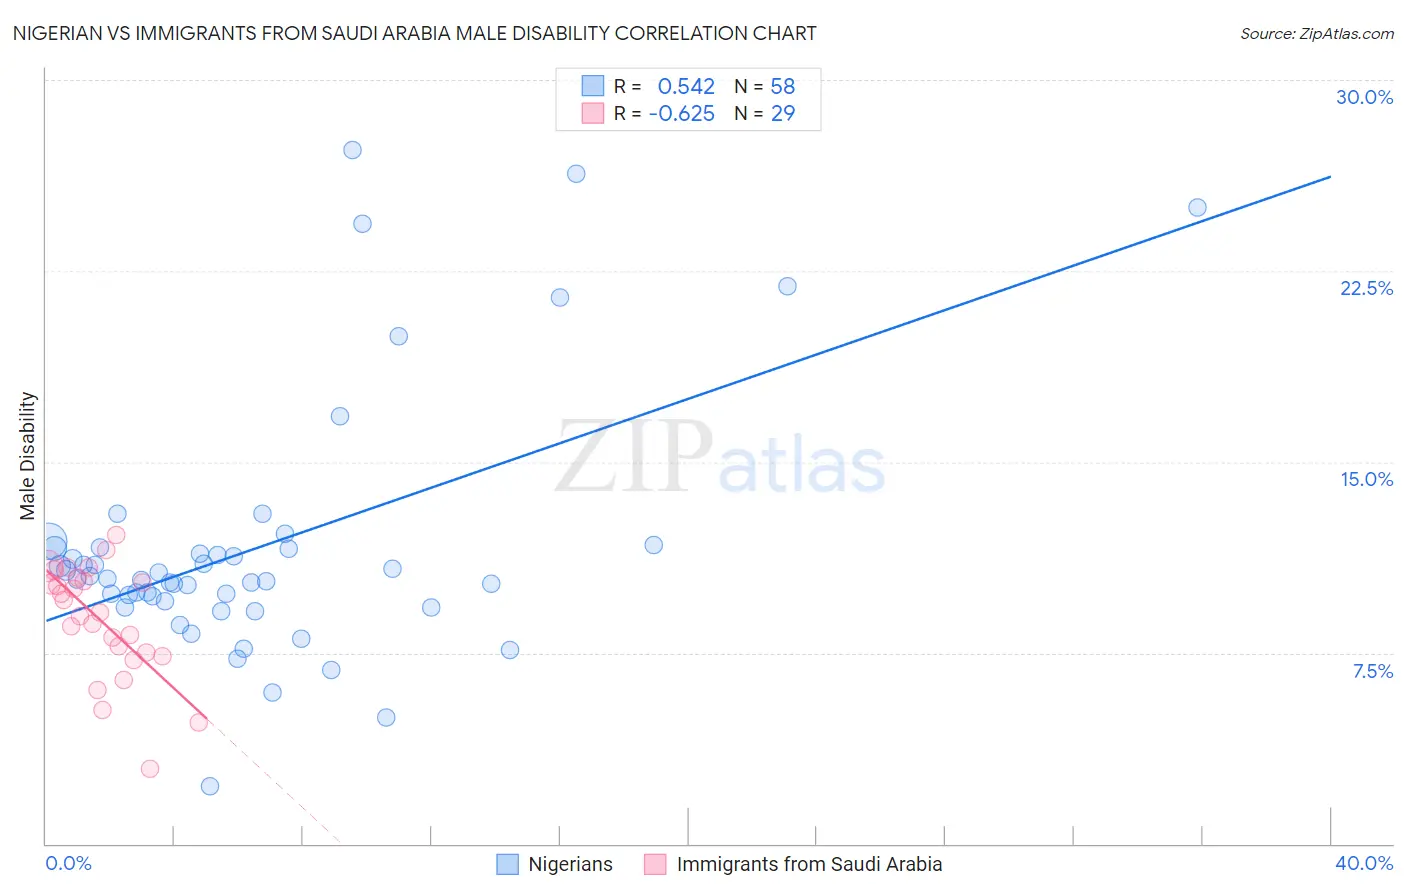
Nigerian vs Immigrants from Saudi Arabia Male Disability Correlation Chart
The statistical analysis conducted on geographies consisting of 332,727,494 people shows a substantial positive correlation between the proportion of Nigerians and percentage of males with a disability in the United States with a correlation coefficient (R) of 0.542 and weighted average of 11.0%. Similarly, the statistical analysis conducted on geographies consisting of 164,290,331 people shows a significant negative correlation between the proportion of Immigrants from Saudi Arabia and percentage of males with a disability in the United States with a correlation coefficient (R) of -0.625 and weighted average of 10.4%, a difference of 6.0%.
Male Disability Correlation Summary
| Measurement | Nigerian | Immigrants from Saudi Arabia |
| Minimum | 2.2% | 3.0% |
| Maximum | 27.3% | 12.2% |
| Range | 25.0% | 9.2% |
| Mean | 11.7% | 8.8% |
| Median | 10.4% | 9.1% |
| Interquartile 25% (IQ1) | 9.5% | 7.5% |
| Interquartile 75% (IQ3) | 11.6% | 10.4% |
| Interquartile Range (IQR) | 2.1% | 2.9% |
| Standard Deviation (Sample) | 5.0% | 2.2% |
| Standard Deviation (Population) | 5.0% | 2.1% |
Similar Demographics by Male Disability
Demographics Similar to Nigerians by Male Disability
In terms of male disability, the demographic groups most similar to Nigerians are Immigrants from Europe (11.0%, a difference of 0.010%), South African (11.0%, a difference of 0.020%), Immigrants from Italy (11.0%, a difference of 0.030%), Arab (11.0%, a difference of 0.040%), and Immigrants from Sudan (11.0%, a difference of 0.040%).
| Demographics | Rating | Rank | Male Disability |
| Macedonians | 84.2 /100 | #131 | Excellent 11.0% |
| Immigrants | Fiji | 84.0 /100 | #132 | Excellent 11.0% |
| Ugandans | 83.9 /100 | #133 | Excellent 11.0% |
| Bhutanese | 83.4 /100 | #134 | Excellent 11.0% |
| Trinidadians and Tobagonians | 83.3 /100 | #135 | Excellent 11.0% |
| Immigrants | Costa Rica | 82.8 /100 | #136 | Excellent 11.0% |
| Immigrants | Europe | 82.0 /100 | #137 | Excellent 11.0% |
| Nigerians | 81.9 /100 | #138 | Excellent 11.0% |
| South Africans | 81.7 /100 | #139 | Excellent 11.0% |
| Immigrants | Italy | 81.5 /100 | #140 | Excellent 11.0% |
| Arabs | 81.5 /100 | #141 | Excellent 11.0% |
| Immigrants | Sudan | 81.5 /100 | #142 | Excellent 11.0% |
| Moroccans | 80.7 /100 | #143 | Excellent 11.0% |
| Kenyans | 78.1 /100 | #144 | Good 11.0% |
| Costa Ricans | 78.0 /100 | #145 | Good 11.0% |
Demographics Similar to Immigrants from Saudi Arabia by Male Disability
In terms of male disability, the demographic groups most similar to Immigrants from Saudi Arabia are Salvadoran (10.4%, a difference of 0.020%), Immigrants from Uzbekistan (10.4%, a difference of 0.020%), Peruvian (10.4%, a difference of 0.060%), Immigrants from Eritrea (10.4%, a difference of 0.080%), and Tongan (10.4%, a difference of 0.12%).
| Demographics | Rating | Rank | Male Disability |
| Turks | 99.7 /100 | #45 | Exceptional 10.3% |
| Cambodians | 99.7 /100 | #46 | Exceptional 10.3% |
| Immigrants | Peru | 99.7 /100 | #47 | Exceptional 10.3% |
| Israelis | 99.7 /100 | #48 | Exceptional 10.3% |
| Immigrants | Spain | 99.7 /100 | #49 | Exceptional 10.3% |
| South Americans | 99.6 /100 | #50 | Exceptional 10.3% |
| Salvadorans | 99.6 /100 | #51 | Exceptional 10.4% |
| Immigrants | Saudi Arabia | 99.6 /100 | #52 | Exceptional 10.4% |
| Immigrants | Uzbekistan | 99.6 /100 | #53 | Exceptional 10.4% |
| Peruvians | 99.6 /100 | #54 | Exceptional 10.4% |
| Immigrants | Eritrea | 99.6 /100 | #55 | Exceptional 10.4% |
| Tongans | 99.6 /100 | #56 | Exceptional 10.4% |
| Immigrants | South America | 99.6 /100 | #57 | Exceptional 10.4% |
| Immigrants | Japan | 99.5 /100 | #58 | Exceptional 10.4% |
| Immigrants | Australia | 99.5 /100 | #59 | Exceptional 10.4% |