Immigrants from El Salvador vs Immigrants from Saudi Arabia Male Disability
COMPARE
Immigrants from El Salvador
Immigrants from Saudi Arabia
Male Disability
Male Disability Comparison
Immigrants from El Salvador
Immigrants from Saudi Arabia
10.3%
MALE DISABILITY
99.7/ 100
METRIC RATING
44th/ 347
METRIC RANK
10.4%
MALE DISABILITY
99.6/ 100
METRIC RATING
52nd/ 347
METRIC RANK
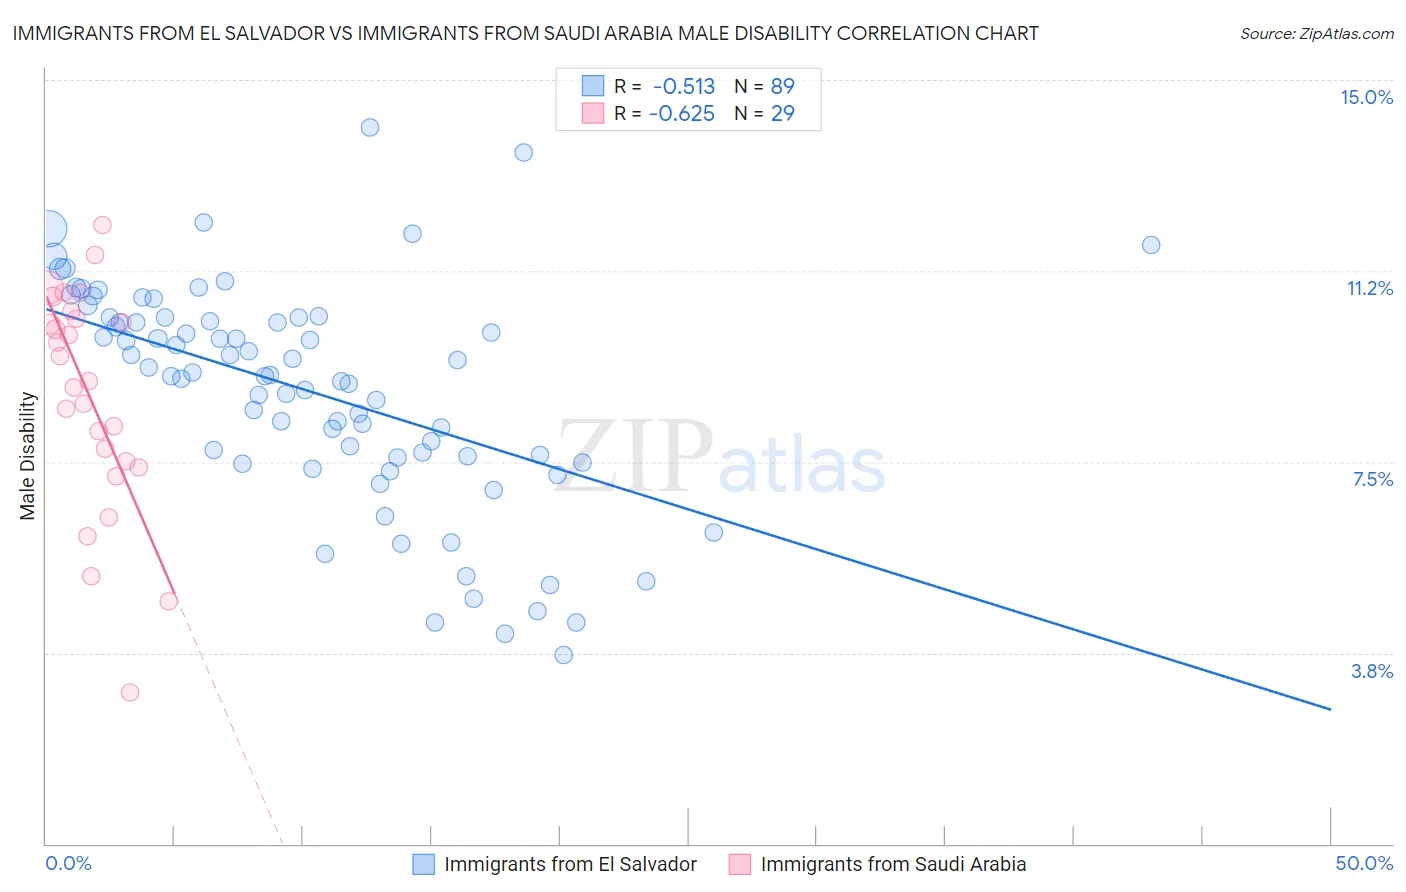
Immigrants from El Salvador vs Immigrants from Saudi Arabia Male Disability Correlation Chart
The statistical analysis conducted on geographies consisting of 357,750,884 people shows a substantial negative correlation between the proportion of Immigrants from El Salvador and percentage of males with a disability in the United States with a correlation coefficient (R) of -0.513 and weighted average of 10.3%. Similarly, the statistical analysis conducted on geographies consisting of 164,290,331 people shows a significant negative correlation between the proportion of Immigrants from Saudi Arabia and percentage of males with a disability in the United States with a correlation coefficient (R) of -0.625 and weighted average of 10.4%, a difference of 0.56%.
Male Disability Correlation Summary
| Measurement | Immigrants from El Salvador | Immigrants from Saudi Arabia |
| Minimum | 3.7% | 3.0% |
| Maximum | 14.1% | 12.2% |
| Range | 10.4% | 9.2% |
| Mean | 8.9% | 8.8% |
| Median | 9.2% | 9.1% |
| Interquartile 25% (IQ1) | 7.6% | 7.5% |
| Interquartile 75% (IQ3) | 10.3% | 10.4% |
| Interquartile Range (IQR) | 2.7% | 2.9% |
| Standard Deviation (Sample) | 2.2% | 2.2% |
| Standard Deviation (Population) | 2.2% | 2.1% |
Demographics Similar to Immigrants from El Salvador and Immigrants from Saudi Arabia by Male Disability
In terms of male disability, the demographic groups most similar to Immigrants from El Salvador are Turkish (10.3%, a difference of 0.0%), Immigrants from Bangladesh (10.3%, a difference of 0.070%), Mongolian (10.3%, a difference of 0.090%), Cambodian (10.3%, a difference of 0.090%), and Immigrants from Peru (10.3%, a difference of 0.12%). Similarly, the demographic groups most similar to Immigrants from Saudi Arabia are Salvadoran (10.4%, a difference of 0.020%), Immigrants from Uzbekistan (10.4%, a difference of 0.020%), Peruvian (10.4%, a difference of 0.060%), Immigrants from Eritrea (10.4%, a difference of 0.080%), and Tongan (10.4%, a difference of 0.12%).
| Demographics | Rating | Rank | Male Disability |
| Immigrants | Kuwait | 99.8 /100 | #38 | Exceptional 10.2% |
| Afghans | 99.8 /100 | #39 | Exceptional 10.2% |
| Immigrants | Nepal | 99.8 /100 | #40 | Exceptional 10.3% |
| Taiwanese | 99.8 /100 | #41 | Exceptional 10.3% |
| Mongolians | 99.7 /100 | #42 | Exceptional 10.3% |
| Immigrants | Bangladesh | 99.7 /100 | #43 | Exceptional 10.3% |
| Immigrants | El Salvador | 99.7 /100 | #44 | Exceptional 10.3% |
| Turks | 99.7 /100 | #45 | Exceptional 10.3% |
| Cambodians | 99.7 /100 | #46 | Exceptional 10.3% |
| Immigrants | Peru | 99.7 /100 | #47 | Exceptional 10.3% |
| Israelis | 99.7 /100 | #48 | Exceptional 10.3% |
| Immigrants | Spain | 99.7 /100 | #49 | Exceptional 10.3% |
| South Americans | 99.6 /100 | #50 | Exceptional 10.3% |
| Salvadorans | 99.6 /100 | #51 | Exceptional 10.4% |
| Immigrants | Saudi Arabia | 99.6 /100 | #52 | Exceptional 10.4% |
| Immigrants | Uzbekistan | 99.6 /100 | #53 | Exceptional 10.4% |
| Peruvians | 99.6 /100 | #54 | Exceptional 10.4% |
| Immigrants | Eritrea | 99.6 /100 | #55 | Exceptional 10.4% |
| Tongans | 99.6 /100 | #56 | Exceptional 10.4% |
| Immigrants | South America | 99.6 /100 | #57 | Exceptional 10.4% |
| Immigrants | Japan | 99.5 /100 | #58 | Exceptional 10.4% |