Hawaiian vs Immigrants from Saudi Arabia Unemployment Among Ages 25 to 29 years
COMPARE
Hawaiian
Immigrants from Saudi Arabia
Unemployment Among Ages 25 to 29 years
Unemployment Among Ages 25 to 29 years Comparison
Hawaiians
Immigrants from Saudi Arabia
6.8%
UNEMPLOYMENT AMONG AGES 25 TO 29 YEARS
17.1/ 100
METRIC RATING
209th/ 347
METRIC RANK
6.2%
UNEMPLOYMENT AMONG AGES 25 TO 29 YEARS
98.6/ 100
METRIC RATING
57th/ 347
METRIC RANK
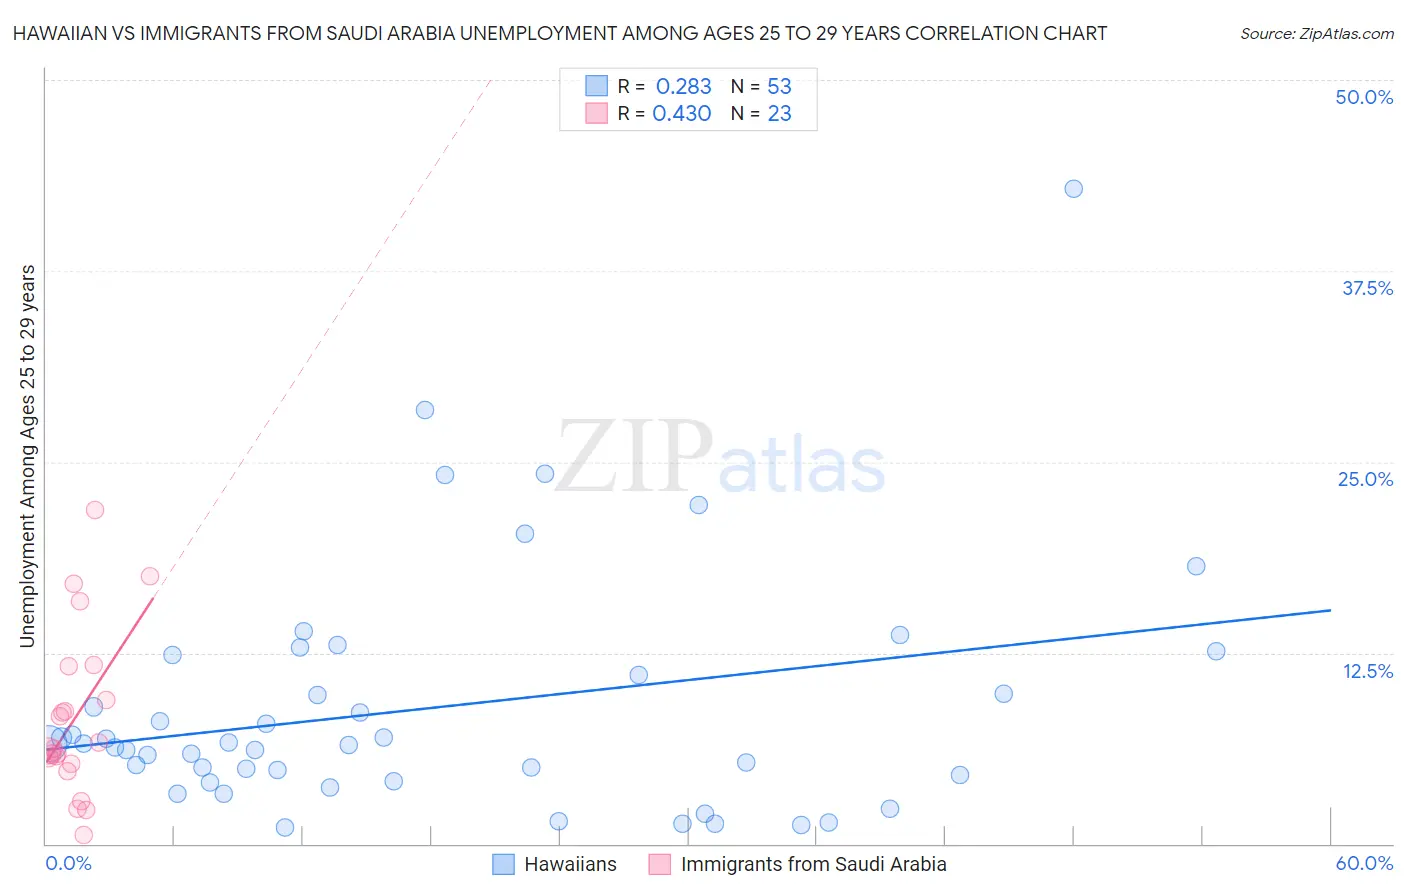
Hawaiian vs Immigrants from Saudi Arabia Unemployment Among Ages 25 to 29 years Correlation Chart
The statistical analysis conducted on geographies consisting of 314,743,173 people shows a weak positive correlation between the proportion of Hawaiians and unemployment rate among population between the ages 25 and 29 in the United States with a correlation coefficient (R) of 0.283 and weighted average of 6.8%. Similarly, the statistical analysis conducted on geographies consisting of 162,055,099 people shows a moderate positive correlation between the proportion of Immigrants from Saudi Arabia and unemployment rate among population between the ages 25 and 29 in the United States with a correlation coefficient (R) of 0.430 and weighted average of 6.2%, a difference of 9.6%.
Unemployment Among Ages 25 to 29 years Correlation Summary
| Measurement | Hawaiian | Immigrants from Saudi Arabia |
| Minimum | 1.1% | 0.60% |
| Maximum | 42.9% | 21.9% |
| Range | 41.8% | 21.3% |
| Mean | 8.9% | 8.3% |
| Median | 6.5% | 6.2% |
| Interquartile 25% (IQ1) | 4.3% | 5.2% |
| Interquartile 75% (IQ3) | 11.7% | 11.6% |
| Interquartile Range (IQR) | 7.4% | 6.4% |
| Standard Deviation (Sample) | 7.9% | 5.4% |
| Standard Deviation (Population) | 7.9% | 5.3% |
Similar Demographics by Unemployment Among Ages 25 to 29 years
Demographics Similar to Hawaiians by Unemployment Among Ages 25 to 29 years
In terms of unemployment among ages 25 to 29 years, the demographic groups most similar to Hawaiians are Canadian (6.8%, a difference of 0.020%), Immigrants from Philippines (6.8%, a difference of 0.050%), Immigrants from Cabo Verde (6.8%, a difference of 0.10%), Immigrants from Germany (6.8%, a difference of 0.18%), and Immigrants from Denmark (6.8%, a difference of 0.20%).
| Demographics | Rating | Rank | Unemployment Among Ages 25 to 29 years |
| Immigrants | Argentina | 21.6 /100 | #202 | Fair 6.8% |
| Immigrants | Norway | 21.2 /100 | #203 | Fair 6.8% |
| Scotch-Irish | 20.0 /100 | #204 | Poor 6.8% |
| Immigrants | England | 19.8 /100 | #205 | Poor 6.8% |
| Ugandans | 19.8 /100 | #206 | Poor 6.8% |
| Immigrants | Denmark | 19.0 /100 | #207 | Poor 6.8% |
| Immigrants | Germany | 18.8 /100 | #208 | Poor 6.8% |
| Hawaiians | 17.1 /100 | #209 | Poor 6.8% |
| Canadians | 16.9 /100 | #210 | Poor 6.8% |
| Immigrants | Philippines | 16.7 /100 | #211 | Poor 6.8% |
| Immigrants | Cabo Verde | 16.2 /100 | #212 | Poor 6.8% |
| Immigrants | Syria | 15.1 /100 | #213 | Poor 6.8% |
| Liberians | 14.7 /100 | #214 | Poor 6.8% |
| Spanish | 14.4 /100 | #215 | Poor 6.8% |
| Slovaks | 14.3 /100 | #216 | Poor 6.8% |
Demographics Similar to Immigrants from Saudi Arabia by Unemployment Among Ages 25 to 29 years
In terms of unemployment among ages 25 to 29 years, the demographic groups most similar to Immigrants from Saudi Arabia are Immigrants from Burma/Myanmar (6.2%, a difference of 0.090%), Immigrants from Netherlands (6.2%, a difference of 0.11%), Immigrants from Eastern Asia (6.2%, a difference of 0.16%), Swedish (6.2%, a difference of 0.29%), and Luxembourger (6.2%, a difference of 0.29%).
| Demographics | Rating | Rank | Unemployment Among Ages 25 to 29 years |
| Soviet Union | 98.9 /100 | #50 | Exceptional 6.2% |
| Burmese | 98.9 /100 | #51 | Exceptional 6.2% |
| Immigrants | Turkey | 98.9 /100 | #52 | Exceptional 6.2% |
| Turks | 98.8 /100 | #53 | Exceptional 6.2% |
| Swedes | 98.8 /100 | #54 | Exceptional 6.2% |
| Immigrants | Netherlands | 98.7 /100 | #55 | Exceptional 6.2% |
| Immigrants | Burma/Myanmar | 98.7 /100 | #56 | Exceptional 6.2% |
| Immigrants | Saudi Arabia | 98.6 /100 | #57 | Exceptional 6.2% |
| Immigrants | Eastern Asia | 98.4 /100 | #58 | Exceptional 6.2% |
| Luxembourgers | 98.3 /100 | #59 | Exceptional 6.2% |
| Immigrants | Taiwan | 98.3 /100 | #60 | Exceptional 6.2% |
| Bhutanese | 98.2 /100 | #61 | Exceptional 6.2% |
| Immigrants | China | 98.1 /100 | #62 | Exceptional 6.2% |
| Kenyans | 98.0 /100 | #63 | Exceptional 6.3% |
| Immigrants | Sri Lanka | 97.9 /100 | #64 | Exceptional 6.3% |