Guyanese vs Yakama Hearing Disability
COMPARE
Guyanese
Yakama
Hearing Disability
Hearing Disability Comparison
Guyanese
Yakama
2.3%
HEARING DISABILITY
100.0/ 100
METRIC RATING
3rd/ 347
METRIC RANK
3.9%
HEARING DISABILITY
0.0/ 100
METRIC RATING
314th/ 347
METRIC RANK
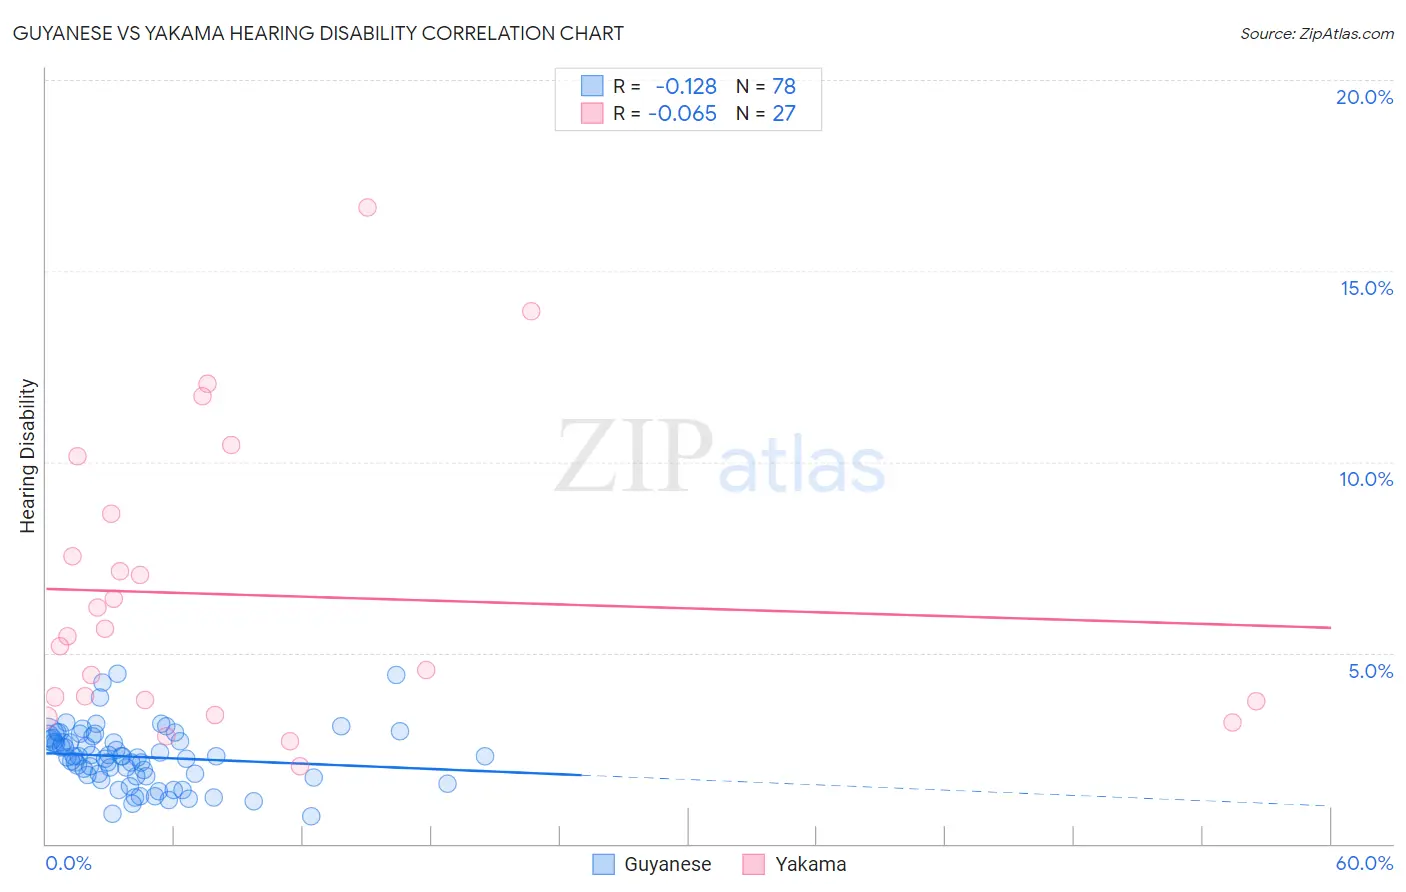
Guyanese vs Yakama Hearing Disability Correlation Chart
The statistical analysis conducted on geographies consisting of 176,815,788 people shows a poor negative correlation between the proportion of Guyanese and percentage of population with hearing disability in the United States with a correlation coefficient (R) of -0.128 and weighted average of 2.3%. Similarly, the statistical analysis conducted on geographies consisting of 19,917,800 people shows a slight negative correlation between the proportion of Yakama and percentage of population with hearing disability in the United States with a correlation coefficient (R) of -0.065 and weighted average of 3.9%, a difference of 72.7%.
Hearing Disability Correlation Summary
| Measurement | Guyanese | Yakama |
| Minimum | 0.72% | 2.0% |
| Maximum | 4.4% | 16.7% |
| Range | 3.7% | 14.6% |
| Mean | 2.3% | 6.5% |
| Median | 2.3% | 5.4% |
| Interquartile 25% (IQ1) | 1.8% | 3.7% |
| Interquartile 75% (IQ3) | 2.8% | 8.6% |
| Interquartile Range (IQR) | 0.99% | 4.9% |
| Standard Deviation (Sample) | 0.77% | 3.8% |
| Standard Deviation (Population) | 0.76% | 3.7% |
Similar Demographics by Hearing Disability
Demographics Similar to Guyanese by Hearing Disability
In terms of hearing disability, the demographic groups most similar to Guyanese are Immigrants from St. Vincent and the Grenadines (2.3%, a difference of 1.4%), Immigrants from Guyana (2.3%, a difference of 1.4%), Immigrants from Barbados (2.4%, a difference of 3.3%), Immigrants from Grenada (2.2%, a difference of 4.3%), and Vietnamese (2.4%, a difference of 4.5%).
| Demographics | Rating | Rank | Hearing Disability |
| Immigrants | Grenada | 100.0 /100 | #1 | Exceptional 2.2% |
| Immigrants | St. Vincent and the Grenadines | 100.0 /100 | #2 | Exceptional 2.3% |
| Guyanese | 100.0 /100 | #3 | Exceptional 2.3% |
| Immigrants | Guyana | 100.0 /100 | #4 | Exceptional 2.3% |
| Immigrants | Barbados | 100.0 /100 | #5 | Exceptional 2.4% |
| Vietnamese | 100.0 /100 | #6 | Exceptional 2.4% |
| Immigrants | Bangladesh | 100.0 /100 | #7 | Exceptional 2.4% |
| British West Indians | 100.0 /100 | #8 | Exceptional 2.4% |
| Immigrants | Dominican Republic | 100.0 /100 | #9 | Exceptional 2.4% |
| Immigrants | Ecuador | 99.9 /100 | #10 | Exceptional 2.5% |
| Immigrants | Trinidad and Tobago | 99.9 /100 | #11 | Exceptional 2.5% |
| Trinidadians and Tobagonians | 99.9 /100 | #12 | Exceptional 2.5% |
| Sierra Leoneans | 99.9 /100 | #13 | Exceptional 2.5% |
| Ecuadorians | 99.9 /100 | #14 | Exceptional 2.5% |
| Barbadians | 99.9 /100 | #15 | Exceptional 2.5% |
Demographics Similar to Yakama by Hearing Disability
In terms of hearing disability, the demographic groups most similar to Yakama are Puget Sound Salish (3.9%, a difference of 0.010%), Hopi (3.9%, a difference of 0.17%), Spanish American (4.0%, a difference of 0.21%), Cajun (3.9%, a difference of 0.28%), and Comanche (4.0%, a difference of 0.34%).
| Demographics | Rating | Rank | Hearing Disability |
| French Canadians | 0.0 /100 | #307 | Tragic 3.8% |
| Ottawa | 0.0 /100 | #308 | Tragic 3.8% |
| Scotch-Irish | 0.0 /100 | #309 | Tragic 3.8% |
| Cree | 0.0 /100 | #310 | Tragic 3.8% |
| Americans | 0.0 /100 | #311 | Tragic 3.9% |
| Cajuns | 0.0 /100 | #312 | Tragic 3.9% |
| Hopi | 0.0 /100 | #313 | Tragic 3.9% |
| Yakama | 0.0 /100 | #314 | Tragic 3.9% |
| Puget Sound Salish | 0.0 /100 | #315 | Tragic 3.9% |
| Spanish Americans | 0.0 /100 | #316 | Tragic 4.0% |
| Comanche | 0.0 /100 | #317 | Tragic 4.0% |
| Cheyenne | 0.0 /100 | #318 | Tragic 4.0% |
| Chippewa | 0.0 /100 | #319 | Tragic 4.0% |
| Shoshone | 0.0 /100 | #320 | Tragic 4.0% |
| Paiute | 0.0 /100 | #321 | Tragic 4.1% |