Guyanese vs Pennsylvania German Hearing Disability
COMPARE
Guyanese
Pennsylvania German
Hearing Disability
Hearing Disability Comparison
Guyanese
Pennsylvania Germans
2.3%
HEARING DISABILITY
100.0/ 100
METRIC RATING
3rd/ 347
METRIC RANK
3.7%
HEARING DISABILITY
0.0/ 100
METRIC RATING
301st/ 347
METRIC RANK
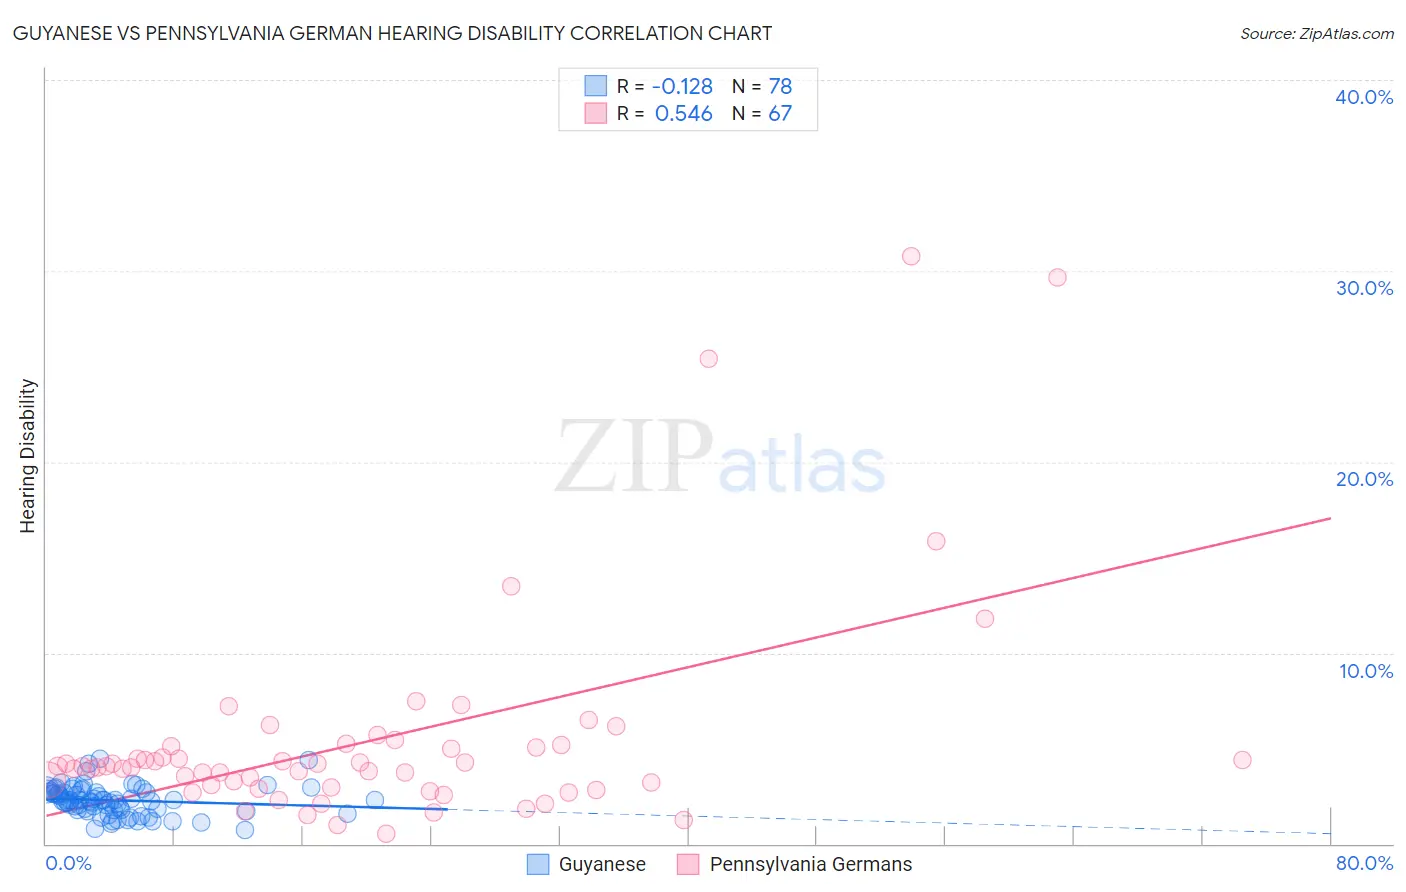
Guyanese vs Pennsylvania German Hearing Disability Correlation Chart
The statistical analysis conducted on geographies consisting of 176,815,788 people shows a poor negative correlation between the proportion of Guyanese and percentage of population with hearing disability in the United States with a correlation coefficient (R) of -0.128 and weighted average of 2.3%. Similarly, the statistical analysis conducted on geographies consisting of 234,065,533 people shows a substantial positive correlation between the proportion of Pennsylvania Germans and percentage of population with hearing disability in the United States with a correlation coefficient (R) of 0.546 and weighted average of 3.7%, a difference of 63.5%.
Hearing Disability Correlation Summary
| Measurement | Guyanese | Pennsylvania German |
| Minimum | 0.72% | 0.51% |
| Maximum | 4.4% | 30.8% |
| Range | 3.7% | 30.3% |
| Mean | 2.3% | 5.4% |
| Median | 2.3% | 4.0% |
| Interquartile 25% (IQ1) | 1.8% | 3.0% |
| Interquartile 75% (IQ3) | 2.8% | 5.1% |
| Interquartile Range (IQR) | 0.99% | 2.1% |
| Standard Deviation (Sample) | 0.77% | 5.7% |
| Standard Deviation (Population) | 0.76% | 5.6% |
Similar Demographics by Hearing Disability
Demographics Similar to Guyanese by Hearing Disability
In terms of hearing disability, the demographic groups most similar to Guyanese are Immigrants from St. Vincent and the Grenadines (2.3%, a difference of 1.4%), Immigrants from Guyana (2.3%, a difference of 1.4%), Immigrants from Barbados (2.4%, a difference of 3.3%), Immigrants from Grenada (2.2%, a difference of 4.3%), and Vietnamese (2.4%, a difference of 4.5%).
| Demographics | Rating | Rank | Hearing Disability |
| Immigrants | Grenada | 100.0 /100 | #1 | Exceptional 2.2% |
| Immigrants | St. Vincent and the Grenadines | 100.0 /100 | #2 | Exceptional 2.3% |
| Guyanese | 100.0 /100 | #3 | Exceptional 2.3% |
| Immigrants | Guyana | 100.0 /100 | #4 | Exceptional 2.3% |
| Immigrants | Barbados | 100.0 /100 | #5 | Exceptional 2.4% |
| Vietnamese | 100.0 /100 | #6 | Exceptional 2.4% |
| Immigrants | Bangladesh | 100.0 /100 | #7 | Exceptional 2.4% |
| British West Indians | 100.0 /100 | #8 | Exceptional 2.4% |
| Immigrants | Dominican Republic | 100.0 /100 | #9 | Exceptional 2.4% |
| Immigrants | Ecuador | 99.9 /100 | #10 | Exceptional 2.5% |
| Immigrants | Trinidad and Tobago | 99.9 /100 | #11 | Exceptional 2.5% |
| Trinidadians and Tobagonians | 99.9 /100 | #12 | Exceptional 2.5% |
| Sierra Leoneans | 99.9 /100 | #13 | Exceptional 2.5% |
| Ecuadorians | 99.9 /100 | #14 | Exceptional 2.5% |
| Barbadians | 99.9 /100 | #15 | Exceptional 2.5% |
Demographics Similar to Pennsylvania Germans by Hearing Disability
In terms of hearing disability, the demographic groups most similar to Pennsylvania Germans are Scottish (3.7%, a difference of 0.030%), German (3.7%, a difference of 0.090%), Dutch (3.7%, a difference of 0.11%), Menominee (3.7%, a difference of 0.16%), and Celtic (3.7%, a difference of 0.37%).
| Demographics | Rating | Rank | Hearing Disability |
| Iroquois | 0.0 /100 | #294 | Tragic 3.7% |
| Welsh | 0.0 /100 | #295 | Tragic 3.7% |
| Pima | 0.0 /100 | #296 | Tragic 3.7% |
| Immigrants | Azores | 0.0 /100 | #297 | Tragic 3.7% |
| Celtics | 0.0 /100 | #298 | Tragic 3.7% |
| Germans | 0.0 /100 | #299 | Tragic 3.7% |
| Scottish | 0.0 /100 | #300 | Tragic 3.7% |
| Pennsylvania Germans | 0.0 /100 | #301 | Tragic 3.7% |
| Dutch | 0.0 /100 | #302 | Tragic 3.7% |
| Menominee | 0.0 /100 | #303 | Tragic 3.7% |
| French | 0.0 /100 | #304 | Tragic 3.8% |
| English | 0.0 /100 | #305 | Tragic 3.8% |
| Marshallese | 0.0 /100 | #306 | Tragic 3.8% |
| French Canadians | 0.0 /100 | #307 | Tragic 3.8% |
| Ottawa | 0.0 /100 | #308 | Tragic 3.8% |