Portuguese vs Tongan Disability Age 65 to 74
COMPARE
Portuguese
Tongan
Disability Age 65 to 74
Disability Age 65 to 74 Comparison
Portuguese
Tongans
23.5%
DISABILITY AGE 65 TO 74
37.8/ 100
METRIC RATING
187th/ 347
METRIC RANK
23.8%
DISABILITY AGE 65 TO 74
20.8/ 100
METRIC RATING
205th/ 347
METRIC RANK
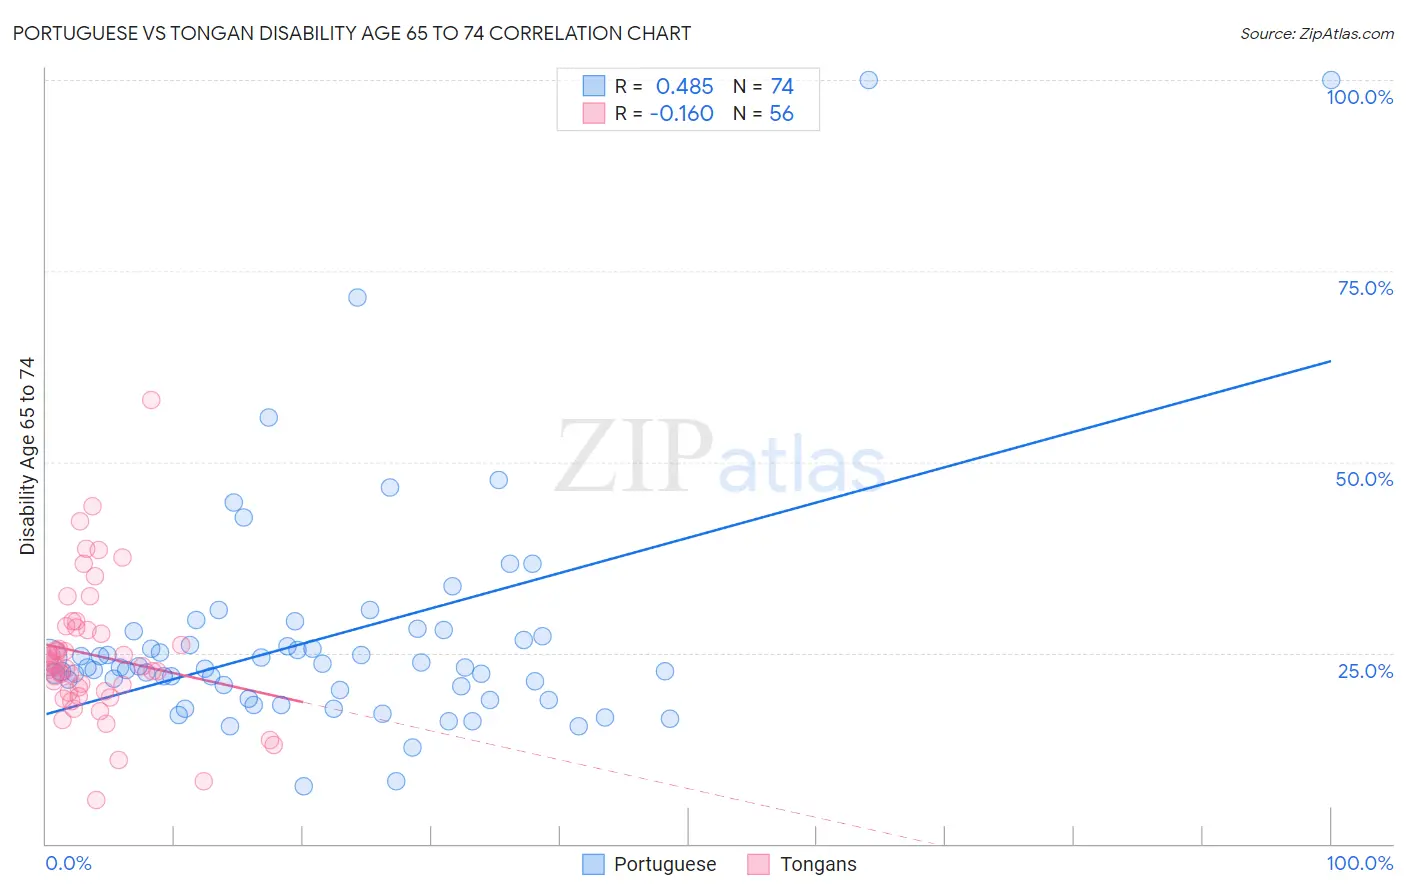
Portuguese vs Tongan Disability Age 65 to 74 Correlation Chart
The statistical analysis conducted on geographies consisting of 449,216,913 people shows a moderate positive correlation between the proportion of Portuguese and percentage of population with a disability between the ages 65 and 75 in the United States with a correlation coefficient (R) of 0.485 and weighted average of 23.5%. Similarly, the statistical analysis conducted on geographies consisting of 102,809,825 people shows a poor negative correlation between the proportion of Tongans and percentage of population with a disability between the ages 65 and 75 in the United States with a correlation coefficient (R) of -0.160 and weighted average of 23.8%, a difference of 1.2%.
Disability Age 65 to 74 Correlation Summary
| Measurement | Portuguese | Tongan |
| Minimum | 7.5% | 5.7% |
| Maximum | 100.0% | 58.2% |
| Range | 92.5% | 52.5% |
| Mean | 27.0% | 24.7% |
| Median | 23.0% | 23.2% |
| Interquartile 25% (IQ1) | 20.1% | 20.0% |
| Interquartile 75% (IQ3) | 27.1% | 28.1% |
| Interquartile Range (IQR) | 7.0% | 8.2% |
| Standard Deviation (Sample) | 15.8% | 9.0% |
| Standard Deviation (Population) | 15.7% | 8.9% |
Demographics Similar to Portuguese and Tongans by Disability Age 65 to 74
In terms of disability age 65 to 74, the demographic groups most similar to Portuguese are Basque (23.5%, a difference of 0.040%), Immigrants from Cuba (23.6%, a difference of 0.24%), Scottish (23.6%, a difference of 0.30%), Immigrants from Guyana (23.6%, a difference of 0.42%), and Immigrants from Bangladesh (23.6%, a difference of 0.49%). Similarly, the demographic groups most similar to Tongans are Immigrants from Jamaica (23.8%, a difference of 0.0%), Immigrants from Grenada (23.8%, a difference of 0.11%), Kenyan (23.7%, a difference of 0.20%), Immigrants from Bahamas (23.7%, a difference of 0.22%), and French Canadian (23.7%, a difference of 0.26%).
| Demographics | Rating | Rank | Disability Age 65 to 74 |
| Basques | 38.4 /100 | #186 | Fair 23.5% |
| Portuguese | 37.8 /100 | #187 | Fair 23.5% |
| Immigrants | Cuba | 34.0 /100 | #188 | Fair 23.6% |
| Scottish | 33.1 /100 | #189 | Fair 23.6% |
| Immigrants | Guyana | 31.2 /100 | #190 | Fair 23.6% |
| Immigrants | Bangladesh | 30.2 /100 | #191 | Fair 23.6% |
| Ecuadorians | 29.7 /100 | #192 | Fair 23.6% |
| English | 28.5 /100 | #193 | Fair 23.6% |
| Sudanese | 27.8 /100 | #194 | Fair 23.7% |
| Immigrants | St. Vincent and the Grenadines | 26.1 /100 | #195 | Fair 23.7% |
| Immigrants | Trinidad and Tobago | 26.1 /100 | #196 | Fair 23.7% |
| Immigrants | Immigrants | 25.8 /100 | #197 | Fair 23.7% |
| Immigrants | Africa | 24.4 /100 | #198 | Fair 23.7% |
| Welsh | 24.3 /100 | #199 | Fair 23.7% |
| French Canadians | 24.0 /100 | #200 | Fair 23.7% |
| Immigrants | Ecuador | 23.9 /100 | #201 | Fair 23.7% |
| Immigrants | Bahamas | 23.3 /100 | #202 | Fair 23.7% |
| Kenyans | 23.2 /100 | #203 | Fair 23.7% |
| Immigrants | Grenada | 22.1 /100 | #204 | Fair 23.8% |
| Tongans | 20.8 /100 | #205 | Fair 23.8% |
| Immigrants | Jamaica | 20.7 /100 | #206 | Fair 23.8% |