Guamanian/Chamorro vs Tongan Child Poverty Among Boys Under 16
COMPARE
Guamanian/Chamorro
Tongan
Child Poverty Among Boys Under 16
Child Poverty Among Boys Under 16 Comparison
Guamanians/Chamorros
Tongans
16.1%
CHILD POVERTY AMONG BOYS UNDER 16
69.6/ 100
METRIC RATING
162nd/ 347
METRIC RANK
13.4%
CHILD POVERTY AMONG BOYS UNDER 16
99.9/ 100
METRIC RATING
22nd/ 347
METRIC RANK
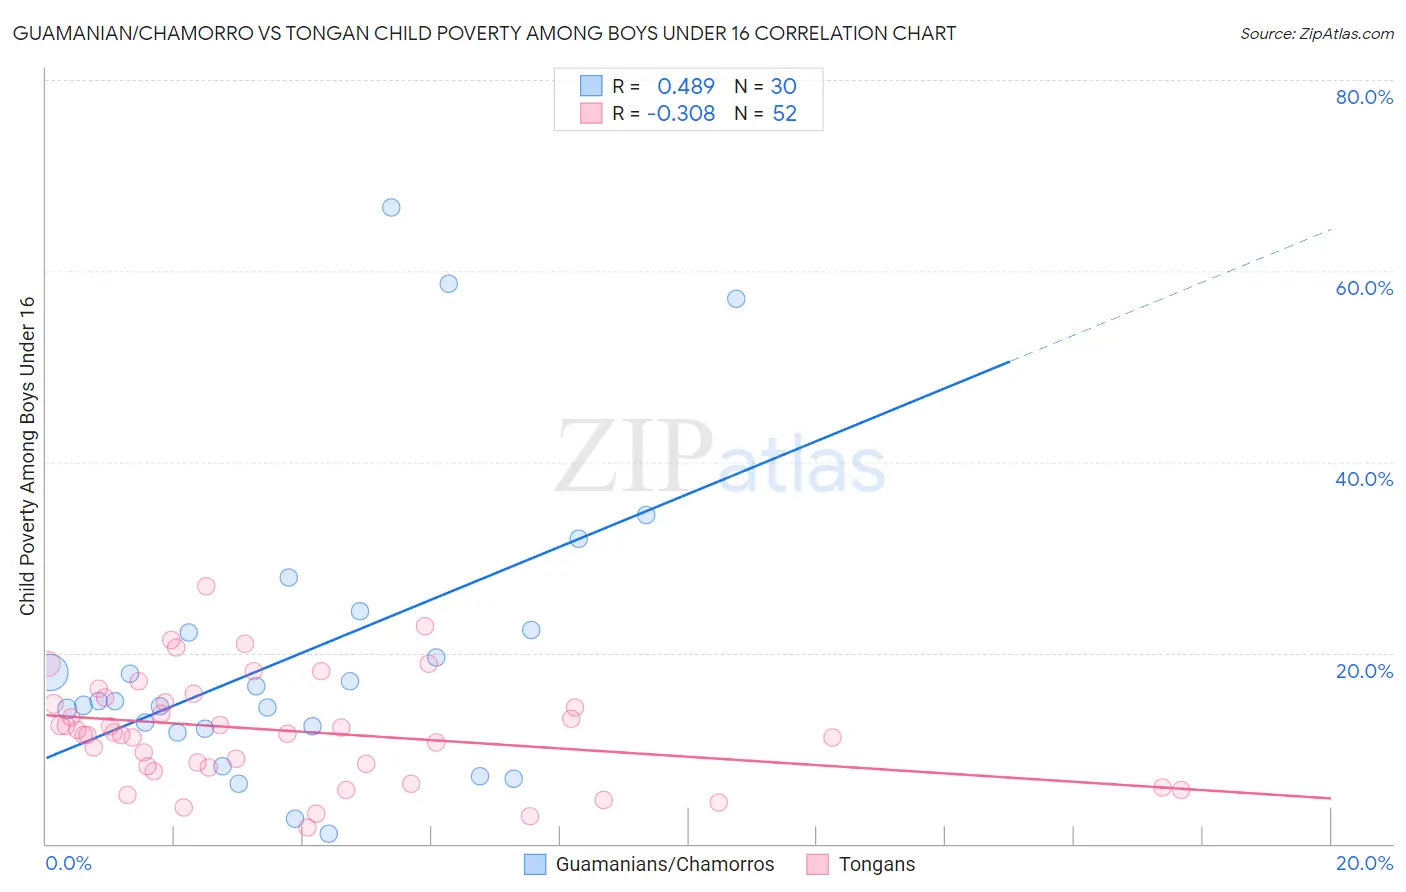
Guamanian/Chamorro vs Tongan Child Poverty Among Boys Under 16 Correlation Chart
The statistical analysis conducted on geographies consisting of 220,488,068 people shows a moderate positive correlation between the proportion of Guamanians/Chamorros and poverty level among boys under the age of 16 in the United States with a correlation coefficient (R) of 0.489 and weighted average of 16.1%. Similarly, the statistical analysis conducted on geographies consisting of 102,543,831 people shows a mild negative correlation between the proportion of Tongans and poverty level among boys under the age of 16 in the United States with a correlation coefficient (R) of -0.308 and weighted average of 13.4%, a difference of 20.2%.
Child Poverty Among Boys Under 16 Correlation Summary
| Measurement | Guamanian/Chamorro | Tongan |
| Minimum | 1.0% | 1.7% |
| Maximum | 66.7% | 27.0% |
| Range | 65.6% | 25.3% |
| Mean | 20.1% | 11.9% |
| Median | 14.9% | 11.5% |
| Interquartile 25% (IQ1) | 12.0% | 8.1% |
| Interquartile 75% (IQ3) | 22.4% | 15.1% |
| Interquartile Range (IQR) | 10.3% | 7.0% |
| Standard Deviation (Sample) | 15.8% | 5.6% |
| Standard Deviation (Population) | 15.6% | 5.5% |
Similar Demographics by Child Poverty Among Boys Under 16
Demographics Similar to Guamanians/Chamorros by Child Poverty Among Boys Under 16
In terms of child poverty among boys under 16, the demographic groups most similar to Guamanians/Chamorros are Costa Rican (16.1%, a difference of 0.20%), Immigrants from Albania (16.1%, a difference of 0.22%), Immigrants from Oceania (16.0%, a difference of 0.23%), Immigrants from Northern Africa (16.0%, a difference of 0.24%), and Colombian (16.1%, a difference of 0.58%).
| Demographics | Rating | Rank | Child Poverty Among Boys Under 16 |
| French Canadians | 76.6 /100 | #155 | Good 15.9% |
| Israelis | 76.5 /100 | #156 | Good 15.9% |
| Immigrants | Nepal | 76.0 /100 | #157 | Good 15.9% |
| Yugoslavians | 75.9 /100 | #158 | Good 15.9% |
| Immigrants | Chile | 74.8 /100 | #159 | Good 15.9% |
| Immigrants | Northern Africa | 71.3 /100 | #160 | Good 16.0% |
| Immigrants | Oceania | 71.3 /100 | #161 | Good 16.0% |
| Guamanians/Chamorros | 69.6 /100 | #162 | Good 16.1% |
| Costa Ricans | 68.1 /100 | #163 | Good 16.1% |
| Immigrants | Albania | 67.9 /100 | #164 | Good 16.1% |
| Colombians | 65.2 /100 | #165 | Good 16.1% |
| Immigrants | Germany | 63.6 /100 | #166 | Good 16.2% |
| Afghans | 55.4 /100 | #167 | Average 16.3% |
| South Americans | 55.3 /100 | #168 | Average 16.3% |
| Immigrants | Saudi Arabia | 53.6 /100 | #169 | Average 16.4% |
Demographics Similar to Tongans by Child Poverty Among Boys Under 16
In terms of child poverty among boys under 16, the demographic groups most similar to Tongans are Immigrants from Eastern Asia (13.3%, a difference of 0.080%), Latvian (13.4%, a difference of 0.080%), Indian (Asian) (13.3%, a difference of 0.68%), Bolivian (13.3%, a difference of 0.72%), and Bulgarian (13.3%, a difference of 0.78%).
| Demographics | Rating | Rank | Child Poverty Among Boys Under 16 |
| Immigrants | Japan | 99.9 /100 | #15 | Exceptional 13.1% |
| Maltese | 99.9 /100 | #16 | Exceptional 13.2% |
| Norwegians | 99.9 /100 | #17 | Exceptional 13.2% |
| Bulgarians | 99.9 /100 | #18 | Exceptional 13.3% |
| Bolivians | 99.9 /100 | #19 | Exceptional 13.3% |
| Indians (Asian) | 99.9 /100 | #20 | Exceptional 13.3% |
| Immigrants | Eastern Asia | 99.9 /100 | #21 | Exceptional 13.3% |
| Tongans | 99.9 /100 | #22 | Exceptional 13.4% |
| Latvians | 99.9 /100 | #23 | Exceptional 13.4% |
| Immigrants | Lithuania | 99.8 /100 | #24 | Exceptional 13.5% |
| Okinawans | 99.8 /100 | #25 | Exceptional 13.5% |
| Immigrants | Bolivia | 99.8 /100 | #26 | Exceptional 13.5% |
| Asians | 99.8 /100 | #27 | Exceptional 13.5% |
| Eastern Europeans | 99.8 /100 | #28 | Exceptional 13.5% |
| Cypriots | 99.8 /100 | #29 | Exceptional 13.6% |