Guamanian/Chamorro vs Navajo Single Mother Households
COMPARE
Guamanian/Chamorro
Navajo
Single Mother Households
Single Mother Households Comparison
Guamanians/Chamorros
Navajo
6.6%
SINGLE MOTHER HOUSEHOLDS
12.4/ 100
METRIC RATING
202nd/ 347
METRIC RANK
8.8%
SINGLE MOTHER HOUSEHOLDS
0.0/ 100
METRIC RATING
337th/ 347
METRIC RANK
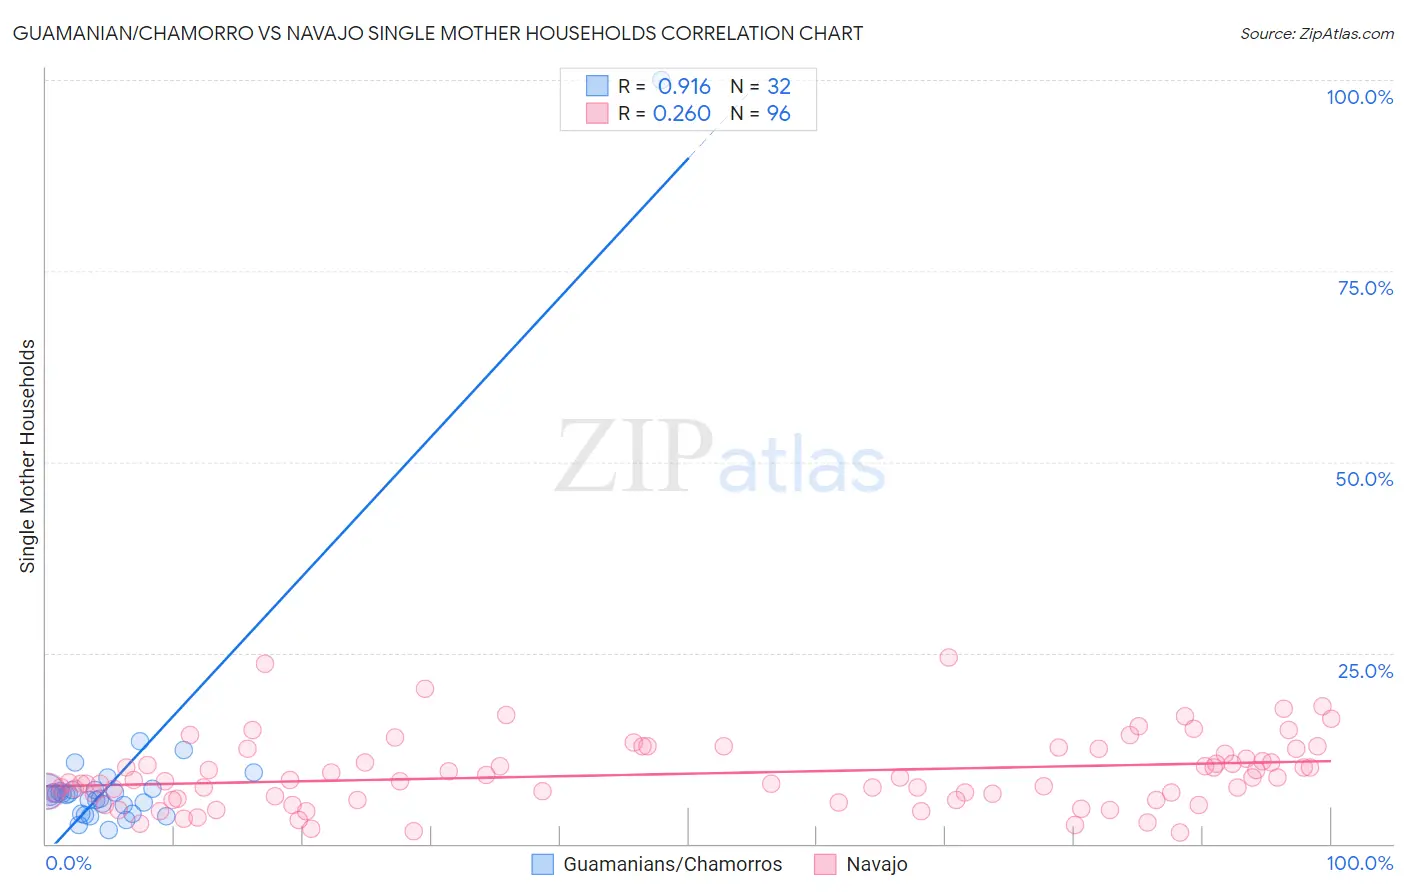
Guamanian/Chamorro vs Navajo Single Mother Households Correlation Chart
The statistical analysis conducted on geographies consisting of 221,648,092 people shows a near-perfect positive correlation between the proportion of Guamanians/Chamorros and percentage of single mother households in the United States with a correlation coefficient (R) of 0.916 and weighted average of 6.6%. Similarly, the statistical analysis conducted on geographies consisting of 224,480,128 people shows a weak positive correlation between the proportion of Navajo and percentage of single mother households in the United States with a correlation coefficient (R) of 0.260 and weighted average of 8.8%, a difference of 33.0%.
Single Mother Households Correlation Summary
| Measurement | Guamanian/Chamorro | Navajo |
| Minimum | 1.8% | 1.4% |
| Maximum | 100.0% | 24.3% |
| Range | 98.2% | 22.9% |
| Mean | 9.2% | 9.1% |
| Median | 6.4% | 8.3% |
| Interquartile 25% (IQ1) | 4.5% | 5.9% |
| Interquartile 75% (IQ3) | 7.1% | 12.1% |
| Interquartile Range (IQR) | 2.5% | 6.2% |
| Standard Deviation (Sample) | 16.8% | 4.6% |
| Standard Deviation (Population) | 16.5% | 4.6% |
Similar Demographics by Single Mother Households
Demographics Similar to Guamanians/Chamorros by Single Mother Households
In terms of single mother households, the demographic groups most similar to Guamanians/Chamorros are Immigrants from Peru (6.7%, a difference of 0.090%), Immigrants from Fiji (6.7%, a difference of 0.11%), Venezuelan (6.6%, a difference of 0.12%), Cree (6.7%, a difference of 0.13%), and German Russian (6.7%, a difference of 0.21%).
| Demographics | Rating | Rank | Single Mother Households |
| South Americans | 18.0 /100 | #195 | Poor 6.6% |
| Uruguayans | 18.0 /100 | #196 | Poor 6.6% |
| Moroccans | 17.4 /100 | #197 | Poor 6.6% |
| Hawaiians | 16.1 /100 | #198 | Poor 6.6% |
| Potawatomi | 15.5 /100 | #199 | Poor 6.6% |
| Immigrants | Ethiopia | 14.7 /100 | #200 | Poor 6.6% |
| Venezuelans | 12.9 /100 | #201 | Poor 6.6% |
| Guamanians/Chamorros | 12.4 /100 | #202 | Poor 6.6% |
| Immigrants | Peru | 12.0 /100 | #203 | Poor 6.7% |
| Immigrants | Fiji | 11.9 /100 | #204 | Poor 6.7% |
| Cree | 11.9 /100 | #205 | Poor 6.7% |
| German Russians | 11.5 /100 | #206 | Poor 6.7% |
| Immigrants | South America | 11.5 /100 | #207 | Poor 6.7% |
| Vietnamese | 11.3 /100 | #208 | Poor 6.7% |
| Immigrants | Colombia | 10.5 /100 | #209 | Poor 6.7% |
Demographics Similar to Navajo by Single Mother Households
In terms of single mother households, the demographic groups most similar to Navajo are Cape Verdean (8.9%, a difference of 0.10%), Puerto Rican (8.7%, a difference of 1.2%), Immigrants from Dominica (8.7%, a difference of 1.2%), Immigrants from Liberia (8.7%, a difference of 1.5%), and Black/African American (9.0%, a difference of 1.7%).
| Demographics | Rating | Rank | Single Mother Households |
| Inupiat | 0.0 /100 | #330 | Tragic 8.5% |
| Sioux | 0.0 /100 | #331 | Tragic 8.5% |
| U.S. Virgin Islanders | 0.0 /100 | #332 | Tragic 8.6% |
| Liberians | 0.0 /100 | #333 | Tragic 8.6% |
| Immigrants | Liberia | 0.0 /100 | #334 | Tragic 8.7% |
| Immigrants | Dominica | 0.0 /100 | #335 | Tragic 8.7% |
| Puerto Ricans | 0.0 /100 | #336 | Tragic 8.7% |
| Navajo | 0.0 /100 | #337 | Tragic 8.8% |
| Cape Verdeans | 0.0 /100 | #338 | Tragic 8.9% |
| Blacks/African Americans | 0.0 /100 | #339 | Tragic 9.0% |
| Lumbee | 0.0 /100 | #340 | Tragic 9.1% |
| Tohono O'odham | 0.0 /100 | #341 | Tragic 9.1% |
| Menominee | 0.0 /100 | #342 | Tragic 9.2% |
| Dominicans | 0.0 /100 | #343 | Tragic 9.2% |
| Immigrants | Dominican Republic | 0.0 /100 | #344 | Tragic 9.5% |