Brazilian vs Navajo Disability
COMPARE
Brazilian
Navajo
Disability
Disability Comparison
Brazilians
Navajo
11.4%
DISABILITY
93.3/ 100
METRIC RATING
122nd/ 347
METRIC RANK
14.3%
DISABILITY
0.0/ 100
METRIC RATING
330th/ 347
METRIC RANK
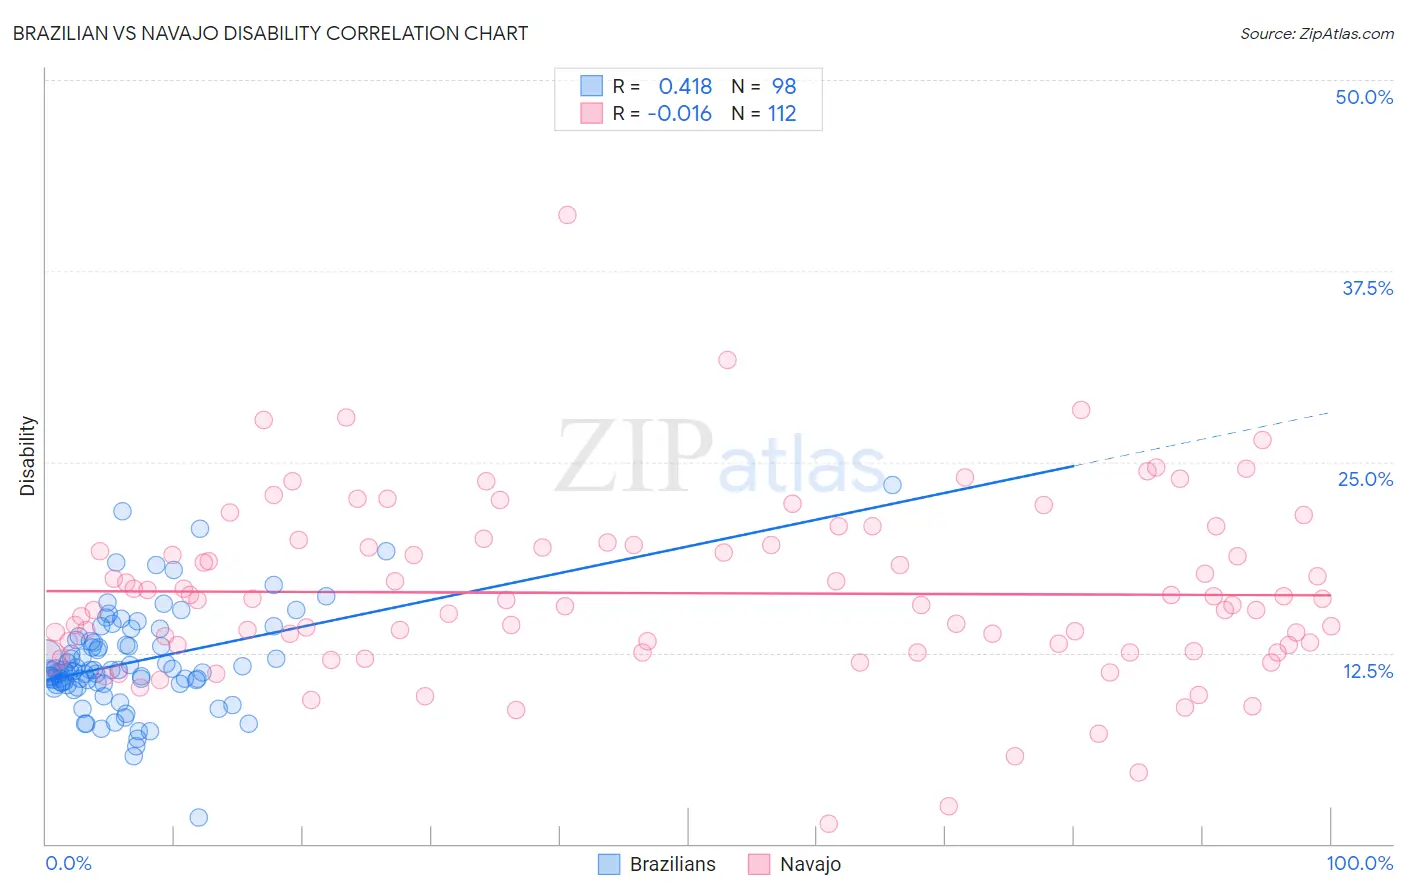
Brazilian vs Navajo Disability Correlation Chart
The statistical analysis conducted on geographies consisting of 323,954,129 people shows a moderate positive correlation between the proportion of Brazilians and percentage of population with a disability in the United States with a correlation coefficient (R) of 0.418 and weighted average of 11.4%. Similarly, the statistical analysis conducted on geographies consisting of 224,790,018 people shows no correlation between the proportion of Navajo and percentage of population with a disability in the United States with a correlation coefficient (R) of -0.016 and weighted average of 14.3%, a difference of 25.5%.
Disability Correlation Summary
| Measurement | Brazilian | Navajo |
| Minimum | 1.7% | 1.3% |
| Maximum | 23.5% | 41.2% |
| Range | 21.8% | 39.9% |
| Mean | 11.9% | 16.4% |
| Median | 11.3% | 15.8% |
| Interquartile 25% (IQ1) | 10.5% | 12.8% |
| Interquartile 75% (IQ3) | 13.3% | 19.5% |
| Interquartile Range (IQR) | 2.8% | 6.7% |
| Standard Deviation (Sample) | 3.3% | 5.9% |
| Standard Deviation (Population) | 3.3% | 5.8% |
Similar Demographics by Disability
Demographics Similar to Brazilians by Disability
In terms of disability, the demographic groups most similar to Brazilians are Immigrants from Costa Rica (11.4%, a difference of 0.020%), Immigrants from North Macedonia (11.4%, a difference of 0.030%), Central American (11.4%, a difference of 0.040%), Korean (11.3%, a difference of 0.090%), and Luxembourger (11.3%, a difference of 0.10%).
| Demographics | Rating | Rank | Disability |
| Immigrants | Philippines | 94.6 /100 | #115 | Exceptional 11.3% |
| Immigrants | Northern Europe | 94.1 /100 | #116 | Exceptional 11.3% |
| Luxembourgers | 93.9 /100 | #117 | Exceptional 11.3% |
| Koreans | 93.8 /100 | #118 | Exceptional 11.3% |
| Central Americans | 93.5 /100 | #119 | Exceptional 11.4% |
| Immigrants | North Macedonia | 93.5 /100 | #120 | Exceptional 11.4% |
| Immigrants | Costa Rica | 93.4 /100 | #121 | Exceptional 11.4% |
| Brazilians | 93.3 /100 | #122 | Exceptional 11.4% |
| South Africans | 92.3 /100 | #123 | Exceptional 11.4% |
| South American Indians | 92.2 /100 | #124 | Exceptional 11.4% |
| Costa Ricans | 91.9 /100 | #125 | Exceptional 11.4% |
| Immigrants | Latvia | 90.9 /100 | #126 | Exceptional 11.4% |
| Immigrants | Italy | 90.4 /100 | #127 | Exceptional 11.4% |
| Immigrants | Europe | 90.4 /100 | #128 | Exceptional 11.4% |
| Macedonians | 90.3 /100 | #129 | Exceptional 11.4% |
Demographics Similar to Navajo by Disability
In terms of disability, the demographic groups most similar to Navajo are Potawatomi (14.2%, a difference of 0.59%), Ottawa (14.2%, a difference of 0.71%), Immigrants from the Azores (14.2%, a difference of 0.71%), Osage (14.2%, a difference of 0.73%), and Native/Alaskan (14.2%, a difference of 0.76%).
| Demographics | Rating | Rank | Disability |
| Comanche | 0.0 /100 | #323 | Tragic 14.1% |
| Chippewa | 0.0 /100 | #324 | Tragic 14.1% |
| Natives/Alaskans | 0.0 /100 | #325 | Tragic 14.2% |
| Osage | 0.0 /100 | #326 | Tragic 14.2% |
| Ottawa | 0.0 /100 | #327 | Tragic 14.2% |
| Immigrants | Azores | 0.0 /100 | #328 | Tragic 14.2% |
| Potawatomi | 0.0 /100 | #329 | Tragic 14.2% |
| Navajo | 0.0 /100 | #330 | Tragic 14.3% |
| Alaskan Athabascans | 0.0 /100 | #331 | Tragic 14.4% |
| Pueblo | 0.0 /100 | #332 | Tragic 14.4% |
| Cajuns | 0.0 /100 | #333 | Tragic 14.6% |
| Yuman | 0.0 /100 | #334 | Tragic 14.6% |
| Tohono O'odham | 0.0 /100 | #335 | Tragic 14.8% |
| Cherokee | 0.0 /100 | #336 | Tragic 14.8% |
| Seminole | 0.0 /100 | #337 | Tragic 14.9% |