Guamanian/Chamorro vs Kiowa Unemployment Among Youth under 25 years
COMPARE
Guamanian/Chamorro
Kiowa
Unemployment Among Youth under 25 years
Unemployment Among Youth under 25 years Comparison
Guamanians/Chamorros
Kiowa
11.9%
UNEMPLOYMENT AMONG YOUTH UNDER 25 YEARS
7.0/ 100
METRIC RATING
216th/ 347
METRIC RANK
12.7%
UNEMPLOYMENT AMONG YOUTH UNDER 25 YEARS
0.0/ 100
METRIC RATING
269th/ 347
METRIC RANK
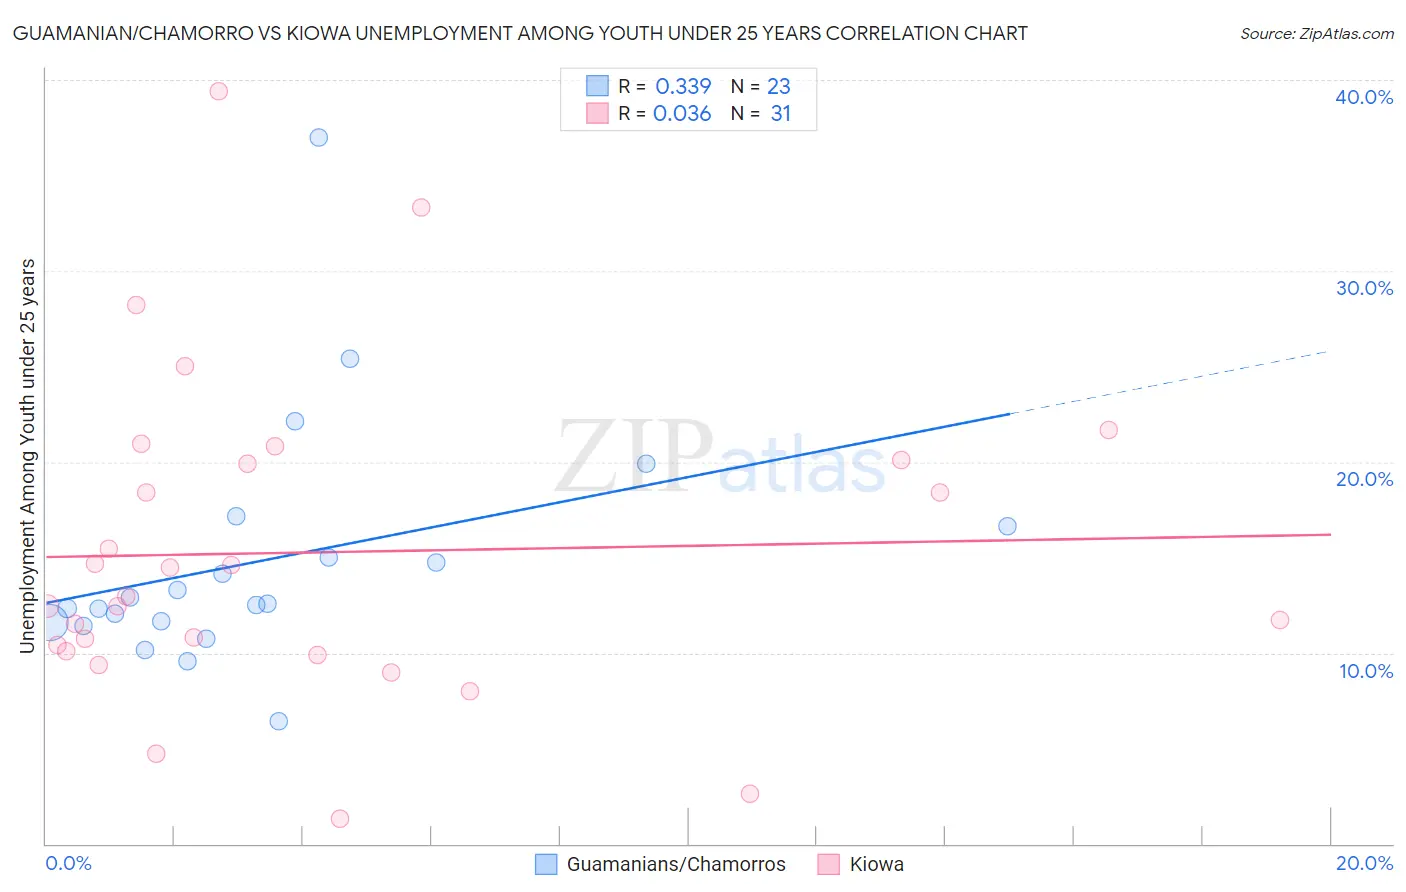
Guamanian/Chamorro vs Kiowa Unemployment Among Youth under 25 years Correlation Chart
The statistical analysis conducted on geographies consisting of 220,678,846 people shows a mild positive correlation between the proportion of Guamanians/Chamorros and unemployment rate among youth under the age of 25 in the United States with a correlation coefficient (R) of 0.339 and weighted average of 11.9%. Similarly, the statistical analysis conducted on geographies consisting of 55,922,493 people shows no correlation between the proportion of Kiowa and unemployment rate among youth under the age of 25 in the United States with a correlation coefficient (R) of 0.036 and weighted average of 12.7%, a difference of 6.4%.
Unemployment Among Youth under 25 years Correlation Summary
| Measurement | Guamanian/Chamorro | Kiowa |
| Minimum | 6.4% | 1.3% |
| Maximum | 37.0% | 39.4% |
| Range | 30.6% | 38.1% |
| Mean | 14.8% | 15.3% |
| Median | 12.6% | 12.9% |
| Interquartile 25% (IQ1) | 11.6% | 10.1% |
| Interquartile 75% (IQ3) | 16.6% | 20.1% |
| Interquartile Range (IQR) | 5.0% | 10.0% |
| Standard Deviation (Sample) | 6.4% | 8.4% |
| Standard Deviation (Population) | 6.2% | 8.2% |
Similar Demographics by Unemployment Among Youth under 25 years
Demographics Similar to Guamanians/Chamorros by Unemployment Among Youth under 25 years
In terms of unemployment among youth under 25 years, the demographic groups most similar to Guamanians/Chamorros are Yaqui (11.9%, a difference of 0.010%), Immigrants from Middle Africa (11.9%, a difference of 0.020%), Samoan (11.9%, a difference of 0.060%), Nonimmigrants (11.9%, a difference of 0.13%), and Alsatian (11.9%, a difference of 0.15%).
| Demographics | Rating | Rank | Unemployment Among Youth under 25 years |
| Immigrants | Lebanon | 11.3 /100 | #209 | Poor 11.8% |
| Assyrians/Chaldeans/Syriacs | 9.8 /100 | #210 | Tragic 11.9% |
| Immigrants | Philippines | 9.2 /100 | #211 | Tragic 11.9% |
| Colombians | 9.1 /100 | #212 | Tragic 11.9% |
| South Americans | 8.5 /100 | #213 | Tragic 11.9% |
| Costa Ricans | 8.2 /100 | #214 | Tragic 11.9% |
| Samoans | 7.4 /100 | #215 | Tragic 11.9% |
| Guamanians/Chamorros | 7.0 /100 | #216 | Tragic 11.9% |
| Yaqui | 6.9 /100 | #217 | Tragic 11.9% |
| Immigrants | Middle Africa | 6.8 /100 | #218 | Tragic 11.9% |
| Immigrants | Nonimmigrants | 6.2 /100 | #219 | Tragic 11.9% |
| Alsatians | 6.1 /100 | #220 | Tragic 11.9% |
| Immigrants | Portugal | 4.9 /100 | #221 | Tragic 12.0% |
| Israelis | 4.1 /100 | #222 | Tragic 12.0% |
| Immigrants | Ireland | 3.5 /100 | #223 | Tragic 12.0% |
Demographics Similar to Kiowa by Unemployment Among Youth under 25 years
In terms of unemployment among youth under 25 years, the demographic groups most similar to Kiowa are Tlingit-Haida (12.7%, a difference of 0.12%), Subsaharan African (12.6%, a difference of 0.20%), Immigrants from Latin America (12.6%, a difference of 0.34%), Immigrants from Liberia (12.8%, a difference of 1.1%), and Nepalese (12.5%, a difference of 1.2%).
| Demographics | Rating | Rank | Unemployment Among Youth under 25 years |
| Immigrants | Mexico | 0.1 /100 | #262 | Tragic 12.4% |
| Cree | 0.1 /100 | #263 | Tragic 12.4% |
| Puget Sound Salish | 0.1 /100 | #264 | Tragic 12.5% |
| Nepalese | 0.0 /100 | #265 | Tragic 12.5% |
| Immigrants | Latin America | 0.0 /100 | #266 | Tragic 12.6% |
| Sub-Saharan Africans | 0.0 /100 | #267 | Tragic 12.6% |
| Tlingit-Haida | 0.0 /100 | #268 | Tragic 12.7% |
| Kiowa | 0.0 /100 | #269 | Tragic 12.7% |
| Immigrants | Liberia | 0.0 /100 | #270 | Tragic 12.8% |
| Immigrants | Bahamas | 0.0 /100 | #271 | Tragic 12.9% |
| Cape Verdeans | 0.0 /100 | #272 | Tragic 12.9% |
| Nigerians | 0.0 /100 | #273 | Tragic 13.0% |
| Immigrants | Nigeria | 0.0 /100 | #274 | Tragic 13.0% |
| Bermudans | 0.0 /100 | #275 | Tragic 13.0% |
| Immigrants | Uzbekistan | 0.0 /100 | #276 | Tragic 13.1% |