Guamanian/Chamorro vs Dominican In Labor Force | Age 45-54
COMPARE
Guamanian/Chamorro
Dominican
In Labor Force | Age 45-54
In Labor Force | Age 45-54 Comparison
Guamanians/Chamorros
Dominicans
81.6%
IN LABOR FORCE | AGE 45-54
0.2/ 100
METRIC RATING
251st/ 347
METRIC RANK
80.3%
IN LABOR FORCE | AGE 45-54
0.0/ 100
METRIC RATING
299th/ 347
METRIC RANK
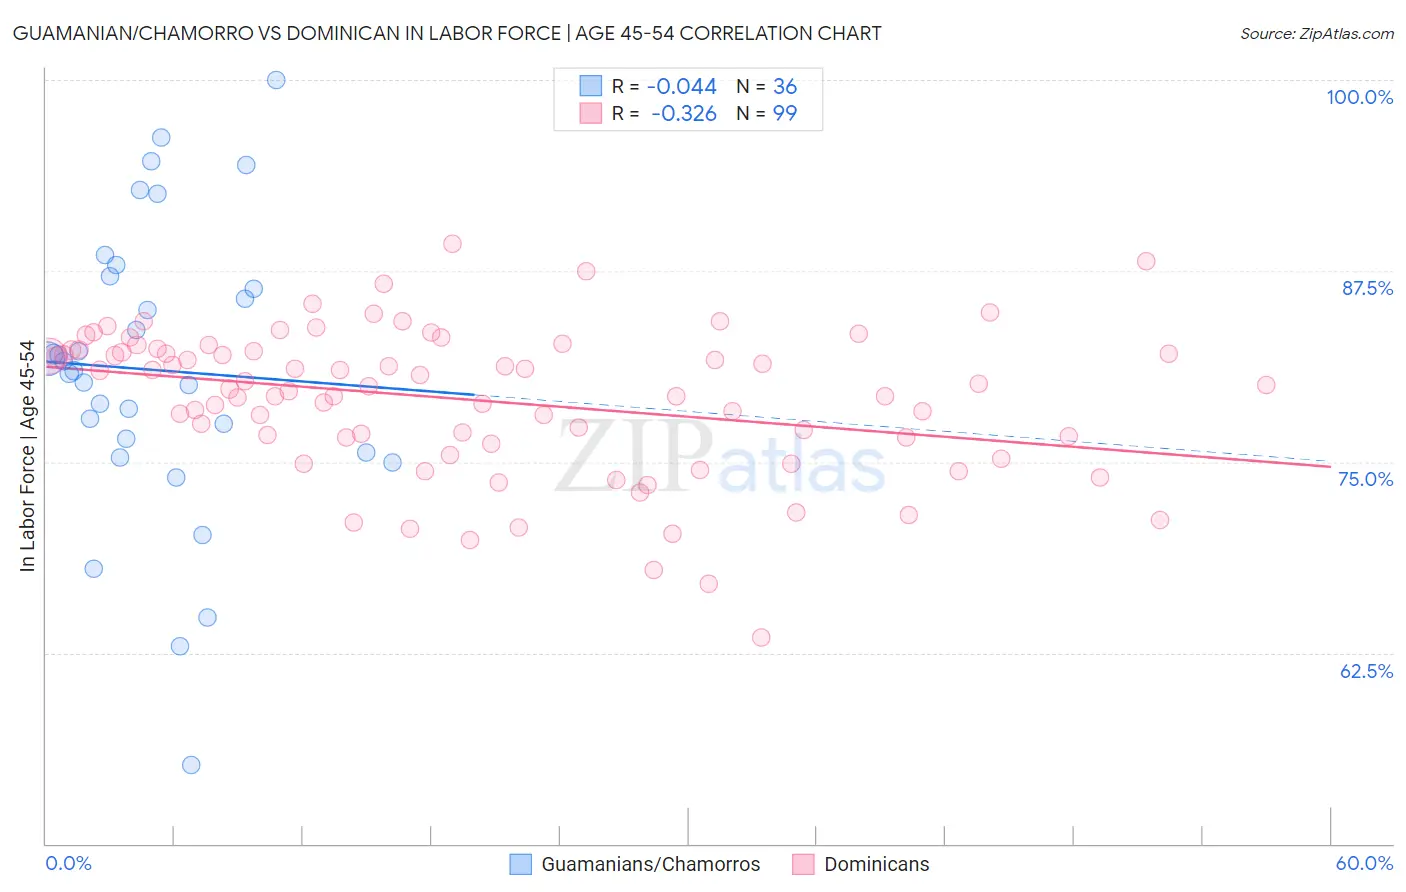
Guamanian/Chamorro vs Dominican In Labor Force | Age 45-54 Correlation Chart
The statistical analysis conducted on geographies consisting of 221,888,798 people shows no correlation between the proportion of Guamanians/Chamorros and labor force participation rate among population between the ages 45 and 54 in the United States with a correlation coefficient (R) of -0.044 and weighted average of 81.6%. Similarly, the statistical analysis conducted on geographies consisting of 354,749,305 people shows a mild negative correlation between the proportion of Dominicans and labor force participation rate among population between the ages 45 and 54 in the United States with a correlation coefficient (R) of -0.326 and weighted average of 80.3%, a difference of 1.7%.
In Labor Force | Age 45-54 Correlation Summary
| Measurement | Guamanian/Chamorro | Dominican |
| Minimum | 55.2% | 63.5% |
| Maximum | 100.0% | 89.3% |
| Range | 44.8% | 25.8% |
| Mean | 81.0% | 79.0% |
| Median | 81.3% | 80.0% |
| Interquartile 25% (IQ1) | 76.0% | 76.6% |
| Interquartile 75% (IQ3) | 86.7% | 82.3% |
| Interquartile Range (IQR) | 10.7% | 5.8% |
| Standard Deviation (Sample) | 9.6% | 4.8% |
| Standard Deviation (Population) | 9.4% | 4.8% |
Similar Demographics by In Labor Force | Age 45-54
Demographics Similar to Guamanians/Chamorros by In Labor Force | Age 45-54
In terms of in labor force | age 45-54, the demographic groups most similar to Guamanians/Chamorros are Immigrants from Armenia (81.7%, a difference of 0.020%), Pennsylvania German (81.6%, a difference of 0.020%), Japanese (81.6%, a difference of 0.040%), Immigrants from Laos (81.6%, a difference of 0.050%), and Scotch-Irish (81.6%, a difference of 0.060%).
| Demographics | Rating | Rank | In Labor Force | Age 45-54 |
| Celtics | 0.4 /100 | #244 | Tragic 81.8% |
| Alaska Natives | 0.4 /100 | #245 | Tragic 81.8% |
| Alaskan Athabascans | 0.4 /100 | #246 | Tragic 81.8% |
| Central Americans | 0.4 /100 | #247 | Tragic 81.7% |
| Puget Sound Salish | 0.3 /100 | #248 | Tragic 81.7% |
| Hmong | 0.3 /100 | #249 | Tragic 81.7% |
| Immigrants | Armenia | 0.2 /100 | #250 | Tragic 81.7% |
| Guamanians/Chamorros | 0.2 /100 | #251 | Tragic 81.6% |
| Pennsylvania Germans | 0.2 /100 | #252 | Tragic 81.6% |
| Japanese | 0.2 /100 | #253 | Tragic 81.6% |
| Immigrants | Laos | 0.2 /100 | #254 | Tragic 81.6% |
| Scotch-Irish | 0.2 /100 | #255 | Tragic 81.6% |
| Barbadians | 0.1 /100 | #256 | Tragic 81.6% |
| Immigrants | Congo | 0.1 /100 | #257 | Tragic 81.6% |
| Immigrants | Fiji | 0.1 /100 | #258 | Tragic 81.5% |
Demographics Similar to Dominicans by In Labor Force | Age 45-54
In terms of in labor force | age 45-54, the demographic groups most similar to Dominicans are Fijian (80.2%, a difference of 0.0%), Spanish American Indian (80.2%, a difference of 0.020%), Immigrants from Central America (80.2%, a difference of 0.10%), Marshallese (80.3%, a difference of 0.11%), and American (80.4%, a difference of 0.15%).
| Demographics | Rating | Rank | In Labor Force | Age 45-54 |
| Iroquois | 0.0 /100 | #292 | Tragic 80.6% |
| Osage | 0.0 /100 | #293 | Tragic 80.6% |
| Yakama | 0.0 /100 | #294 | Tragic 80.6% |
| Nepalese | 0.0 /100 | #295 | Tragic 80.5% |
| Africans | 0.0 /100 | #296 | Tragic 80.5% |
| Americans | 0.0 /100 | #297 | Tragic 80.4% |
| Marshallese | 0.0 /100 | #298 | Tragic 80.3% |
| Dominicans | 0.0 /100 | #299 | Tragic 80.3% |
| Fijians | 0.0 /100 | #300 | Tragic 80.2% |
| Spanish American Indians | 0.0 /100 | #301 | Tragic 80.2% |
| Immigrants | Central America | 0.0 /100 | #302 | Tragic 80.2% |
| Immigrants | Azores | 0.0 /100 | #303 | Tragic 80.1% |
| Hispanics or Latinos | 0.0 /100 | #304 | Tragic 80.1% |
| Immigrants | Dominican Republic | 0.0 /100 | #305 | Tragic 80.1% |
| Spanish Americans | 0.0 /100 | #306 | Tragic 80.1% |