Guamanian/Chamorro vs Dominican Average Family Size
COMPARE
Guamanian/Chamorro
Dominican
Average Family Size
Average Family Size Comparison
Guamanians/Chamorros
Dominicans
3.29
AVERAGE FAMILY SIZE
98.6/ 100
METRIC RATING
100th/ 347
METRIC RANK
3.34
AVERAGE FAMILY SIZE
99.9/ 100
METRIC RATING
64th/ 347
METRIC RANK
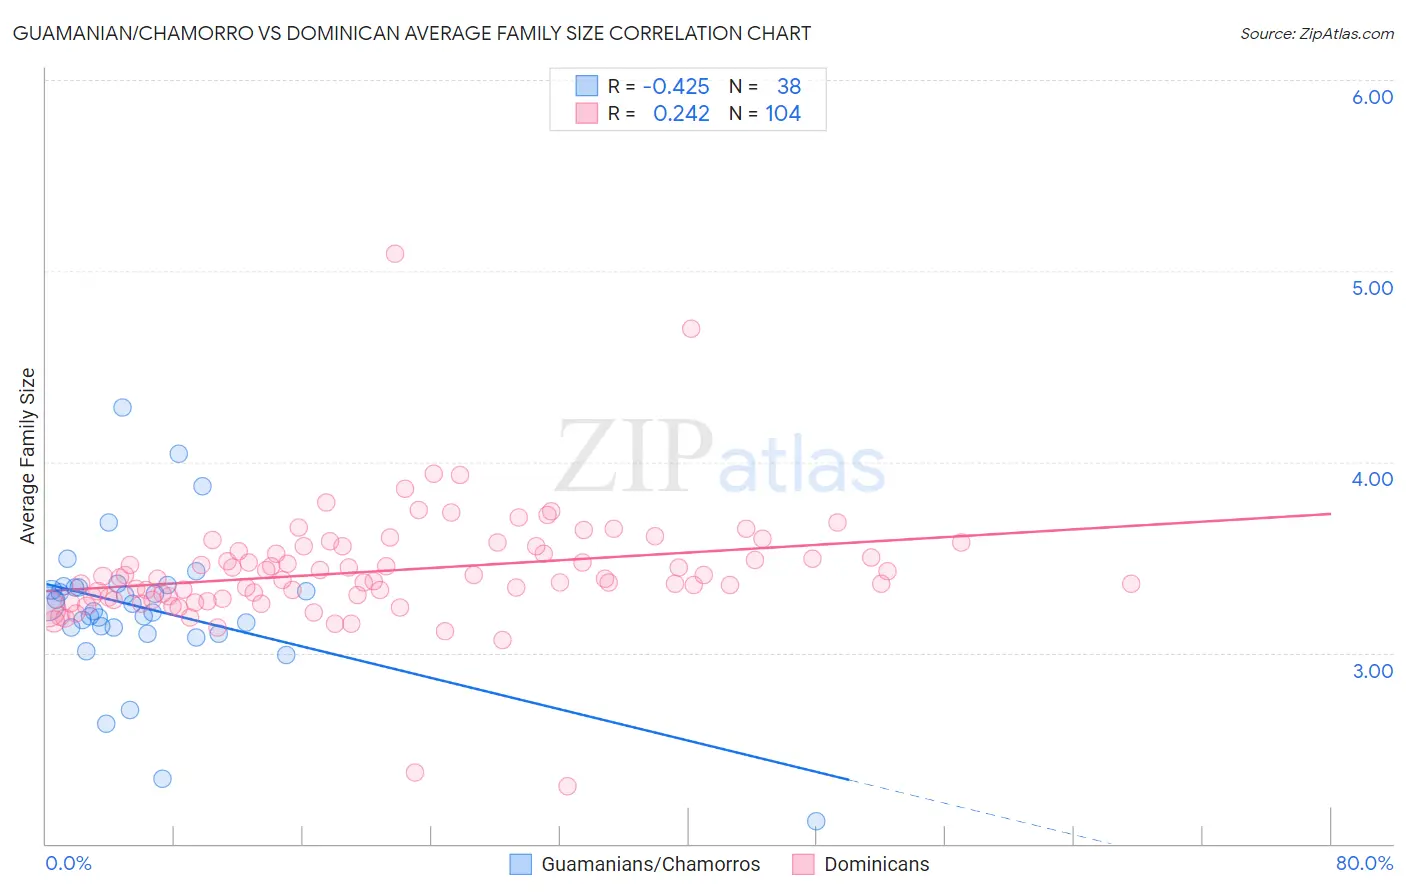
Guamanian/Chamorro vs Dominican Average Family Size Correlation Chart
The statistical analysis conducted on geographies consisting of 221,865,945 people shows a moderate negative correlation between the proportion of Guamanians/Chamorros and average family size in the United States with a correlation coefficient (R) of -0.425 and weighted average of 3.29. Similarly, the statistical analysis conducted on geographies consisting of 354,765,302 people shows a weak positive correlation between the proportion of Dominicans and average family size in the United States with a correlation coefficient (R) of 0.242 and weighted average of 3.34, a difference of 1.4%.
Average Family Size Correlation Summary
| Measurement | Guamanian/Chamorro | Dominican |
| Minimum | 2.12 | 2.30 |
| Maximum | 4.28 | 5.09 |
| Range | 2.16 | 2.79 |
| Mean | 3.23 | 3.43 |
| Median | 3.24 | 3.39 |
| Interquartile 25% (IQ1) | 3.13 | 3.29 |
| Interquartile 75% (IQ3) | 3.34 | 3.54 |
| Interquartile Range (IQR) | 0.21 | 0.26 |
| Standard Deviation (Sample) | 0.38 | 0.31 |
| Standard Deviation (Population) | 0.38 | 0.31 |
Similar Demographics by Average Family Size
Demographics Similar to Guamanians/Chamorros by Average Family Size
In terms of average family size, the demographic groups most similar to Guamanians/Chamorros are Immigrants from Oceania (3.29, a difference of 0.010%), Barbadian (3.29, a difference of 0.010%), Nigerian (3.29, a difference of 0.010%), Immigrants from Burma/Myanmar (3.29, a difference of 0.020%), and West Indian (3.29, a difference of 0.020%).
| Demographics | Rating | Rank | Average Family Size |
| Peruvians | 99.2 /100 | #93 | Exceptional 3.30 |
| Sierra Leoneans | 99.0 /100 | #94 | Exceptional 3.30 |
| Immigrants | Lebanon | 99.0 /100 | #95 | Exceptional 3.30 |
| U.S. Virgin Islanders | 98.8 /100 | #96 | Exceptional 3.29 |
| Immigrants | Oceania | 98.7 /100 | #97 | Exceptional 3.29 |
| Barbadians | 98.6 /100 | #98 | Exceptional 3.29 |
| Nigerians | 98.6 /100 | #99 | Exceptional 3.29 |
| Guamanians/Chamorros | 98.6 /100 | #100 | Exceptional 3.29 |
| Immigrants | Burma/Myanmar | 98.6 /100 | #101 | Exceptional 3.29 |
| West Indians | 98.5 /100 | #102 | Exceptional 3.29 |
| Immigrants | Western Africa | 98.4 /100 | #103 | Exceptional 3.29 |
| Bolivians | 98.3 /100 | #104 | Exceptional 3.29 |
| Immigrants | Ghana | 98.1 /100 | #105 | Exceptional 3.29 |
| Paiute | 98.0 /100 | #106 | Exceptional 3.29 |
| Ghanaians | 98.0 /100 | #107 | Exceptional 3.29 |
Demographics Similar to Dominicans by Average Family Size
In terms of average family size, the demographic groups most similar to Dominicans are Immigrants from Laos (3.34, a difference of 0.020%), Chinese (3.34, a difference of 0.070%), Immigrants from St. Vincent and the Grenadines (3.34, a difference of 0.080%), Immigrants from Grenada (3.34, a difference of 0.090%), and Immigrants from Jamaica (3.33, a difference of 0.12%).
| Demographics | Rating | Rank | Average Family Size |
| Sri Lankans | 100.0 /100 | #57 | Exceptional 3.35 |
| Hondurans | 100.0 /100 | #58 | Exceptional 3.35 |
| Japanese | 100.0 /100 | #59 | Exceptional 3.35 |
| Immigrants | Armenia | 100.0 /100 | #60 | Exceptional 3.35 |
| Central American Indians | 100.0 /100 | #61 | Exceptional 3.35 |
| Immigrants | Grenada | 100.0 /100 | #62 | Exceptional 3.34 |
| Chinese | 100.0 /100 | #63 | Exceptional 3.34 |
| Dominicans | 99.9 /100 | #64 | Exceptional 3.34 |
| Immigrants | Laos | 99.9 /100 | #65 | Exceptional 3.34 |
| Immigrants | St. Vincent and the Grenadines | 99.9 /100 | #66 | Exceptional 3.34 |
| Immigrants | Jamaica | 99.9 /100 | #67 | Exceptional 3.33 |
| Immigrants | Cambodia | 99.9 /100 | #68 | Exceptional 3.33 |
| Immigrants | Immigrants | 99.9 /100 | #69 | Exceptional 3.33 |
| Immigrants | Trinidad and Tobago | 99.9 /100 | #70 | Exceptional 3.33 |
| Immigrants | West Indies | 99.9 /100 | #71 | Exceptional 3.33 |