Assyrian/Chaldean/Syriac vs Cuban Disability Age 18 to 34
COMPARE
Assyrian/Chaldean/Syriac
Cuban
Disability Age 18 to 34
Disability Age 18 to 34 Comparison
Assyrians/Chaldeans/Syriacs
Cubans
6.1%
DISABILITY AGE 18 TO 34
98.9/ 100
METRIC RATING
78th/ 347
METRIC RANK
5.7%
DISABILITY AGE 18 TO 34
100.0/ 100
METRIC RATING
23rd/ 347
METRIC RANK
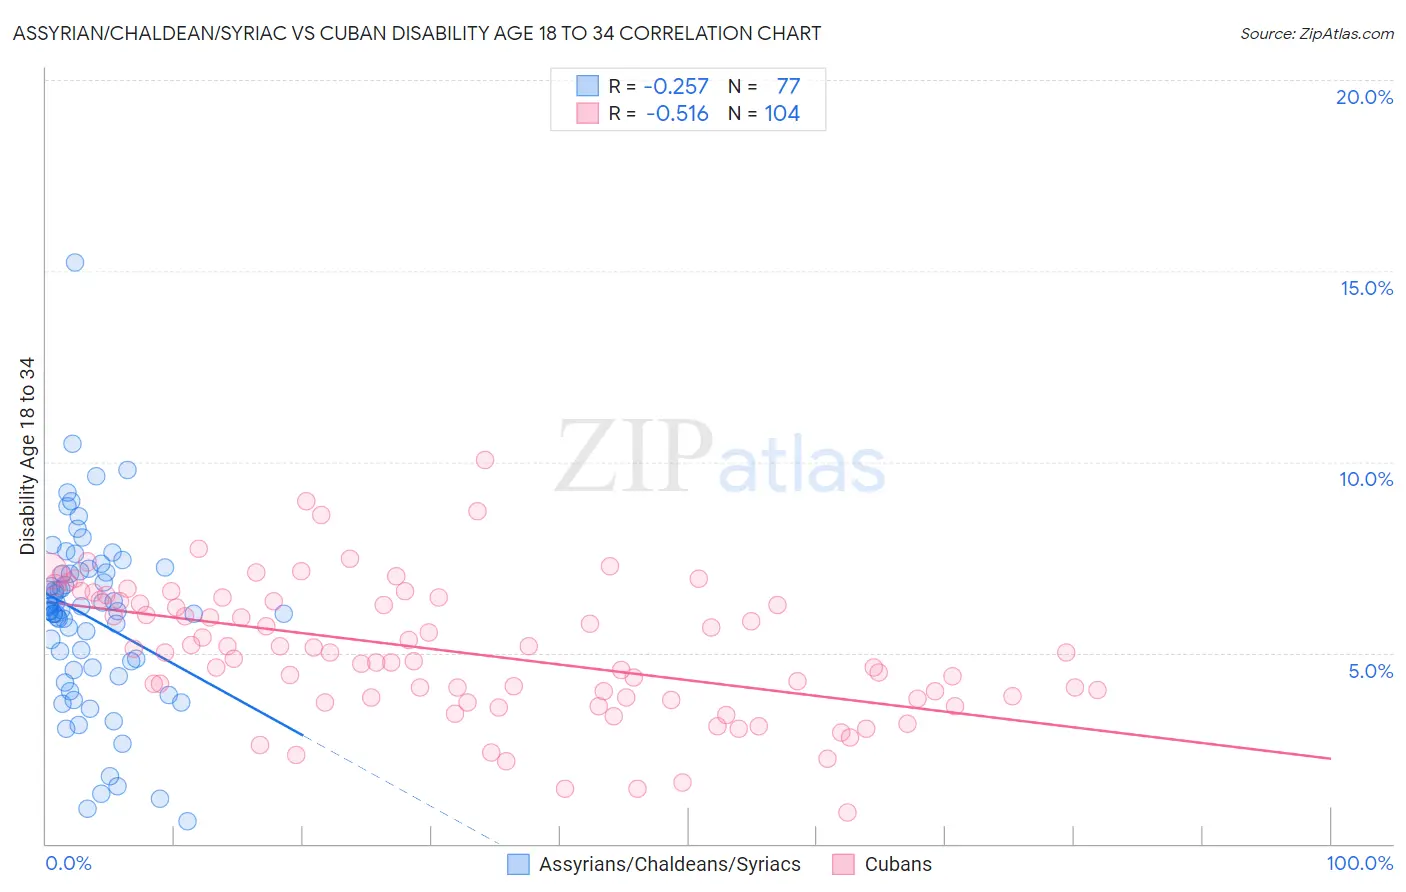
Assyrian/Chaldean/Syriac vs Cuban Disability Age 18 to 34 Correlation Chart
The statistical analysis conducted on geographies consisting of 110,269,916 people shows a weak negative correlation between the proportion of Assyrians/Chaldeans/Syriacs and percentage of population with a disability between the ages 18 and 35 in the United States with a correlation coefficient (R) of -0.257 and weighted average of 6.1%. Similarly, the statistical analysis conducted on geographies consisting of 448,003,598 people shows a substantial negative correlation between the proportion of Cubans and percentage of population with a disability between the ages 18 and 35 in the United States with a correlation coefficient (R) of -0.516 and weighted average of 5.7%, a difference of 6.7%.
Disability Age 18 to 34 Correlation Summary
| Measurement | Assyrian/Chaldean/Syriac | Cuban |
| Minimum | 0.58% | 0.83% |
| Maximum | 15.2% | 10.1% |
| Range | 14.6% | 9.2% |
| Mean | 5.9% | 5.0% |
| Median | 6.1% | 5.0% |
| Interquartile 25% (IQ1) | 4.6% | 3.8% |
| Interquartile 75% (IQ3) | 7.1% | 6.4% |
| Interquartile Range (IQR) | 2.5% | 2.6% |
| Standard Deviation (Sample) | 2.4% | 1.8% |
| Standard Deviation (Population) | 2.3% | 1.8% |
Similar Demographics by Disability Age 18 to 34
Demographics Similar to Assyrians/Chaldeans/Syriacs by Disability Age 18 to 34
In terms of disability age 18 to 34, the demographic groups most similar to Assyrians/Chaldeans/Syriacs are Immigrants from Russia (6.1%, a difference of 0.0%), Immigrants from Western Asia (6.1%, a difference of 0.10%), Afghan (6.1%, a difference of 0.29%), Immigrants from Turkey (6.1%, a difference of 0.38%), and Immigrants from Chile (6.1%, a difference of 0.49%).
| Demographics | Rating | Rank | Disability Age 18 to 34 |
| Immigrants | Japan | 99.3 /100 | #71 | Exceptional 6.0% |
| Immigrants | Lebanon | 99.2 /100 | #72 | Exceptional 6.0% |
| Cypriots | 99.2 /100 | #73 | Exceptional 6.0% |
| Haitians | 99.2 /100 | #74 | Exceptional 6.0% |
| Immigrants | Turkey | 99.1 /100 | #75 | Exceptional 6.1% |
| Immigrants | Western Asia | 98.9 /100 | #76 | Exceptional 6.1% |
| Immigrants | Russia | 98.9 /100 | #77 | Exceptional 6.1% |
| Assyrians/Chaldeans/Syriacs | 98.9 /100 | #78 | Exceptional 6.1% |
| Afghans | 98.7 /100 | #79 | Exceptional 6.1% |
| Immigrants | Chile | 98.5 /100 | #80 | Exceptional 6.1% |
| Immigrants | Australia | 98.5 /100 | #81 | Exceptional 6.1% |
| Immigrants | Northern Africa | 98.4 /100 | #82 | Exceptional 6.1% |
| Barbadians | 98.3 /100 | #83 | Exceptional 6.1% |
| Israelis | 98.3 /100 | #84 | Exceptional 6.1% |
| Immigrants | Ireland | 98.2 /100 | #85 | Exceptional 6.1% |
Demographics Similar to Cubans by Disability Age 18 to 34
In terms of disability age 18 to 34, the demographic groups most similar to Cubans are Immigrants from Argentina (5.7%, a difference of 0.10%), Immigrants from Singapore (5.7%, a difference of 0.14%), Immigrants from Colombia (5.7%, a difference of 0.29%), Immigrants from Venezuela (5.7%, a difference of 0.40%), and Soviet Union (5.7%, a difference of 0.49%).
| Demographics | Rating | Rank | Disability Age 18 to 34 |
| Immigrants | Israel | 100.0 /100 | #16 | Exceptional 5.6% |
| Immigrants | Eastern Asia | 100.0 /100 | #17 | Exceptional 5.6% |
| Immigrants | Bolivia | 100.0 /100 | #18 | Exceptional 5.6% |
| Thais | 100.0 /100 | #19 | Exceptional 5.6% |
| Immigrants | Bangladesh | 100.0 /100 | #20 | Exceptional 5.6% |
| Immigrants | South Central Asia | 100.0 /100 | #21 | Exceptional 5.7% |
| Immigrants | Nicaragua | 100.0 /100 | #22 | Exceptional 5.7% |
| Cubans | 100.0 /100 | #23 | Exceptional 5.7% |
| Immigrants | Argentina | 100.0 /100 | #24 | Exceptional 5.7% |
| Immigrants | Singapore | 100.0 /100 | #25 | Exceptional 5.7% |
| Immigrants | Colombia | 100.0 /100 | #26 | Exceptional 5.7% |
| Immigrants | Venezuela | 99.9 /100 | #27 | Exceptional 5.7% |
| Soviet Union | 99.9 /100 | #28 | Exceptional 5.7% |
| Immigrants | Ecuador | 99.9 /100 | #29 | Exceptional 5.7% |
| Immigrants | Pakistan | 99.9 /100 | #30 | Exceptional 5.8% |