Guamanian/Chamorro vs Cuban Vision Disability
COMPARE
Guamanian/Chamorro
Cuban
Vision Disability
Vision Disability Comparison
Guamanians/Chamorros
Cubans
2.3%
VISION DISABILITY
3.9/ 100
METRIC RATING
220th/ 347
METRIC RANK
2.4%
VISION DISABILITY
0.1/ 100
METRIC RATING
270th/ 347
METRIC RANK
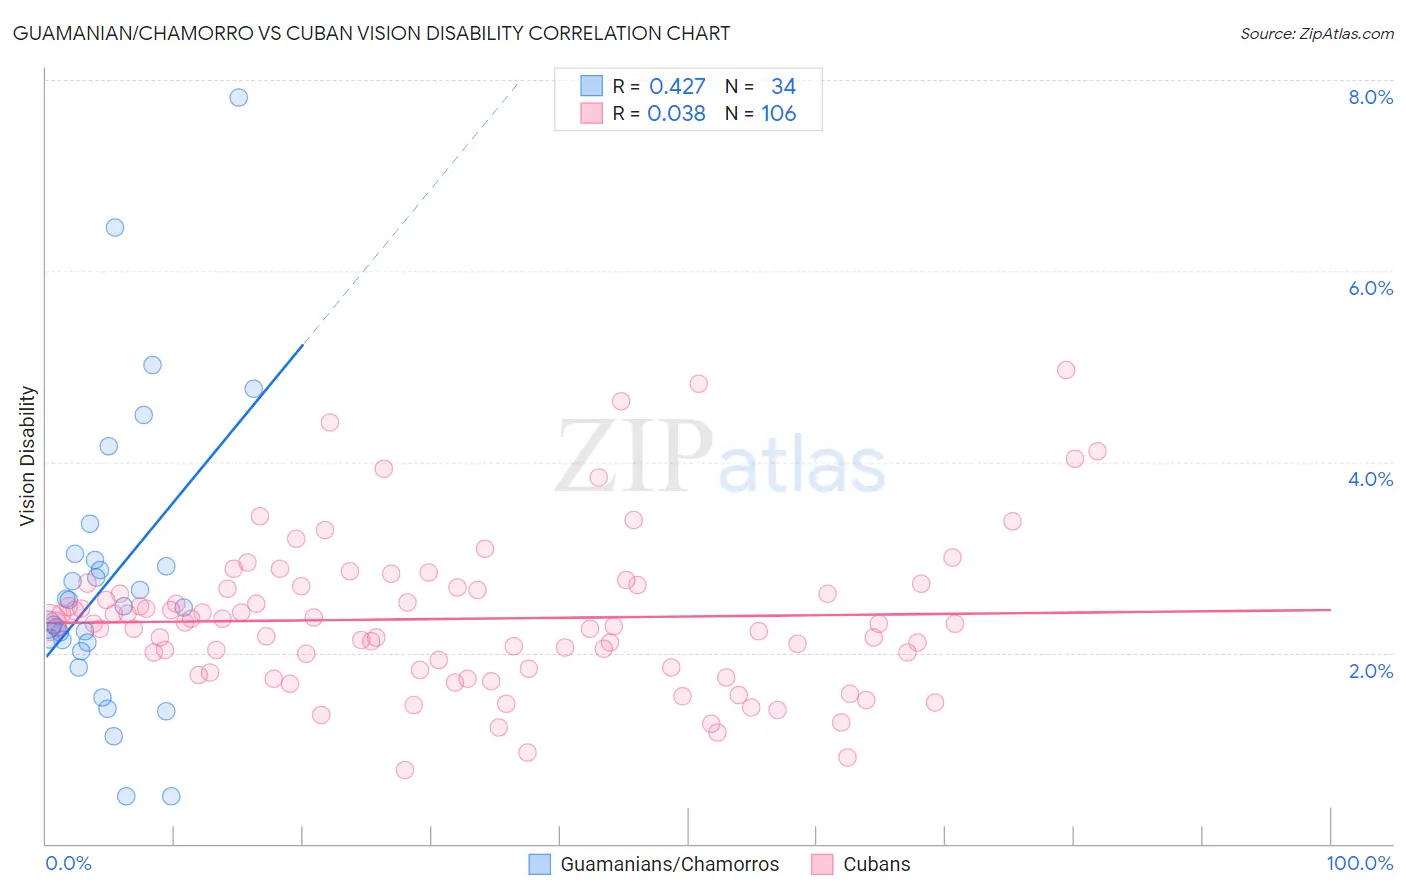
Guamanian/Chamorro vs Cuban Vision Disability Correlation Chart
The statistical analysis conducted on geographies consisting of 221,799,275 people shows a moderate positive correlation between the proportion of Guamanians/Chamorros and percentage of population with vision disability in the United States with a correlation coefficient (R) of 0.427 and weighted average of 2.3%. Similarly, the statistical analysis conducted on geographies consisting of 448,885,451 people shows no correlation between the proportion of Cubans and percentage of population with vision disability in the United States with a correlation coefficient (R) of 0.038 and weighted average of 2.4%, a difference of 5.9%.
Vision Disability Correlation Summary
| Measurement | Guamanian/Chamorro | Cuban |
| Minimum | 0.50% | 0.77% |
| Maximum | 7.8% | 5.0% |
| Range | 7.3% | 4.2% |
| Mean | 2.8% | 2.4% |
| Median | 2.5% | 2.3% |
| Interquartile 25% (IQ1) | 2.1% | 1.8% |
| Interquartile 75% (IQ3) | 3.0% | 2.7% |
| Interquartile Range (IQR) | 0.87% | 0.85% |
| Standard Deviation (Sample) | 1.5% | 0.80% |
| Standard Deviation (Population) | 1.5% | 0.79% |
Similar Demographics by Vision Disability
Demographics Similar to Guamanians/Chamorros by Vision Disability
In terms of vision disability, the demographic groups most similar to Guamanians/Chamorros are French Canadian (2.3%, a difference of 0.020%), Immigrants from Senegal (2.3%, a difference of 0.040%), Basque (2.3%, a difference of 0.18%), Irish (2.3%, a difference of 0.20%), and Immigrants from Western Africa (2.3%, a difference of 0.22%).
| Demographics | Rating | Rank | Vision Disability |
| Immigrants | Ghana | 8.9 /100 | #213 | Tragic 2.2% |
| Trinidadians and Tobagonians | 8.2 /100 | #214 | Tragic 2.2% |
| Nigerians | 7.2 /100 | #215 | Tragic 2.3% |
| Immigrants | Trinidad and Tobago | 6.1 /100 | #216 | Tragic 2.3% |
| Barbadians | 5.1 /100 | #217 | Tragic 2.3% |
| Portuguese | 4.9 /100 | #218 | Tragic 2.3% |
| Ecuadorians | 4.6 /100 | #219 | Tragic 2.3% |
| Guamanians/Chamorros | 3.9 /100 | #220 | Tragic 2.3% |
| French Canadians | 3.9 /100 | #221 | Tragic 2.3% |
| Immigrants | Senegal | 3.8 /100 | #222 | Tragic 2.3% |
| Basques | 3.5 /100 | #223 | Tragic 2.3% |
| Irish | 3.4 /100 | #224 | Tragic 2.3% |
| Immigrants | Western Africa | 3.4 /100 | #225 | Tragic 2.3% |
| Immigrants | Germany | 3.0 /100 | #226 | Tragic 2.3% |
| Hawaiians | 2.9 /100 | #227 | Tragic 2.3% |
Demographics Similar to Cubans by Vision Disability
In terms of vision disability, the demographic groups most similar to Cubans are Celtic (2.4%, a difference of 0.010%), Immigrants from the Azores (2.4%, a difference of 0.16%), Spaniard (2.4%, a difference of 0.26%), Senegalese (2.4%, a difference of 0.28%), and Ute (2.4%, a difference of 0.37%).
| Demographics | Rating | Rank | Vision Disability |
| Immigrants | Belize | 0.1 /100 | #263 | Tragic 2.4% |
| Immigrants | Liberia | 0.1 /100 | #264 | Tragic 2.4% |
| Immigrants | Jamaica | 0.1 /100 | #265 | Tragic 2.4% |
| Mexican American Indians | 0.1 /100 | #266 | Tragic 2.4% |
| Ute | 0.1 /100 | #267 | Tragic 2.4% |
| Senegalese | 0.1 /100 | #268 | Tragic 2.4% |
| Celtics | 0.1 /100 | #269 | Tragic 2.4% |
| Cubans | 0.1 /100 | #270 | Tragic 2.4% |
| Immigrants | Azores | 0.1 /100 | #271 | Tragic 2.4% |
| Spaniards | 0.1 /100 | #272 | Tragic 2.4% |
| Immigrants | Bahamas | 0.1 /100 | #273 | Tragic 2.4% |
| Immigrants | Latin America | 0.0 /100 | #274 | Tragic 2.4% |
| Chippewa | 0.0 /100 | #275 | Tragic 2.4% |
| Scotch-Irish | 0.0 /100 | #276 | Tragic 2.4% |
| Bahamians | 0.0 /100 | #277 | Tragic 2.4% |