Greek vs Immigrants from Italy Hearing Disability
COMPARE
Greek
Immigrants from Italy
Hearing Disability
Hearing Disability Comparison
Greeks
Immigrants from Italy
3.2%
HEARING DISABILITY
3.2/ 100
METRIC RATING
230th/ 347
METRIC RANK
3.0%
HEARING DISABILITY
41.1/ 100
METRIC RATING
182nd/ 347
METRIC RANK
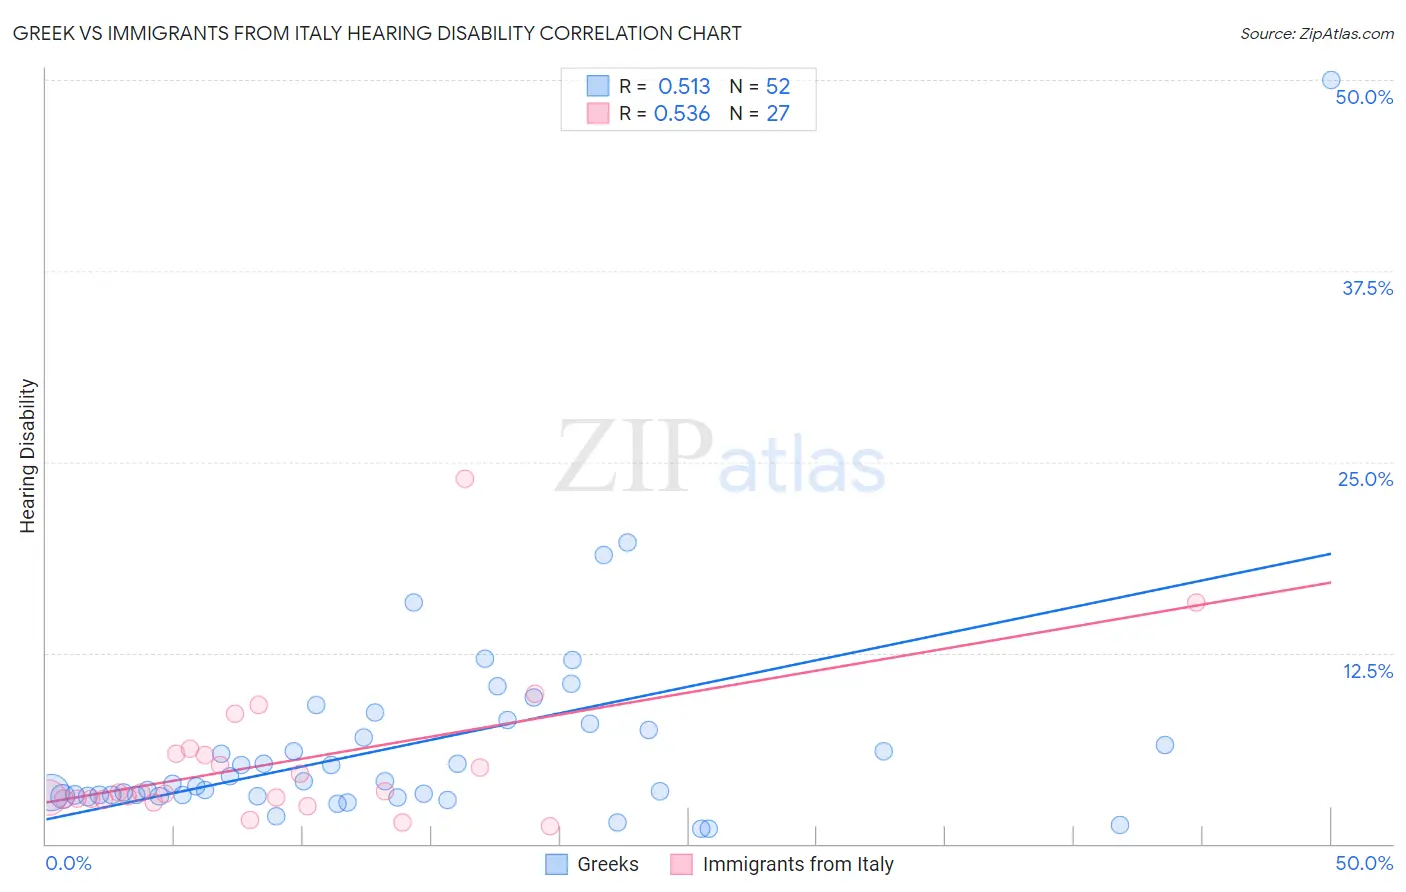
Greek vs Immigrants from Italy Hearing Disability Correlation Chart
The statistical analysis conducted on geographies consisting of 482,523,980 people shows a substantial positive correlation between the proportion of Greeks and percentage of population with hearing disability in the United States with a correlation coefficient (R) of 0.513 and weighted average of 3.2%. Similarly, the statistical analysis conducted on geographies consisting of 324,155,277 people shows a substantial positive correlation between the proportion of Immigrants from Italy and percentage of population with hearing disability in the United States with a correlation coefficient (R) of 0.536 and weighted average of 3.0%, a difference of 7.1%.
Hearing Disability Correlation Summary
| Measurement | Greek | Immigrants from Italy |
| Minimum | 1.0% | 1.1% |
| Maximum | 50.0% | 23.9% |
| Range | 49.0% | 22.8% |
| Mean | 6.5% | 5.3% |
| Median | 4.0% | 3.3% |
| Interquartile 25% (IQ1) | 3.2% | 2.9% |
| Interquartile 75% (IQ3) | 7.6% | 5.9% |
| Interquartile Range (IQR) | 4.5% | 3.0% |
| Standard Deviation (Sample) | 7.4% | 4.9% |
| Standard Deviation (Population) | 7.4% | 4.8% |
Similar Demographics by Hearing Disability
Demographics Similar to Greeks by Hearing Disability
In terms of hearing disability, the demographic groups most similar to Greeks are Luxembourger (3.2%, a difference of 0.23%), Ukrainian (3.2%, a difference of 0.28%), Maltese (3.2%, a difference of 0.51%), Immigrants from Portugal (3.2%, a difference of 0.62%), and Estonian (3.3%, a difference of 0.65%).
| Demographics | Rating | Rank | Hearing Disability |
| Mexicans | 5.6 /100 | #223 | Tragic 3.2% |
| Icelanders | 5.2 /100 | #224 | Tragic 3.2% |
| Latvians | 5.1 /100 | #225 | Tragic 3.2% |
| Lebanese | 5.0 /100 | #226 | Tragic 3.2% |
| Bhutanese | 4.6 /100 | #227 | Tragic 3.2% |
| Immigrants | Portugal | 4.3 /100 | #228 | Tragic 3.2% |
| Maltese | 4.1 /100 | #229 | Tragic 3.2% |
| Greeks | 3.2 /100 | #230 | Tragic 3.2% |
| Luxembourgers | 2.9 /100 | #231 | Tragic 3.2% |
| Ukrainians | 2.9 /100 | #232 | Tragic 3.2% |
| Estonians | 2.4 /100 | #233 | Tragic 3.3% |
| Central American Indians | 2.3 /100 | #234 | Tragic 3.3% |
| Guamanians/Chamorros | 2.2 /100 | #235 | Tragic 3.3% |
| Serbians | 2.2 /100 | #236 | Tragic 3.3% |
| Immigrants | Austria | 1.8 /100 | #237 | Tragic 3.3% |
Demographics Similar to Immigrants from Italy by Hearing Disability
In terms of hearing disability, the demographic groups most similar to Immigrants from Italy are Immigrants from Belgium (3.0%, a difference of 0.030%), Immigrants from Sweden (3.0%, a difference of 0.12%), Bulgarian (3.0%, a difference of 0.14%), Immigrants from Moldova (3.0%, a difference of 0.18%), and Immigrants from Ireland (3.0%, a difference of 0.37%).
| Demographics | Rating | Rank | Hearing Disability |
| Immigrants | Romania | 48.4 /100 | #175 | Average 3.0% |
| Panamanians | 47.0 /100 | #176 | Average 3.0% |
| Immigrants | Philippines | 46.4 /100 | #177 | Average 3.0% |
| Japanese | 46.0 /100 | #178 | Average 3.0% |
| Immigrants | Moldova | 43.1 /100 | #179 | Average 3.0% |
| Immigrants | Sweden | 42.4 /100 | #180 | Average 3.0% |
| Immigrants | Belgium | 41.5 /100 | #181 | Average 3.0% |
| Immigrants | Italy | 41.1 /100 | #182 | Average 3.0% |
| Bulgarians | 39.7 /100 | #183 | Fair 3.0% |
| Immigrants | Ireland | 37.4 /100 | #184 | Fair 3.0% |
| Immigrants | Southern Europe | 35.3 /100 | #185 | Fair 3.0% |
| Immigrants | Mexico | 34.9 /100 | #186 | Fair 3.0% |
| Blacks/African Americans | 34.7 /100 | #187 | Fair 3.0% |
| Mexican American Indians | 34.7 /100 | #188 | Fair 3.0% |
| Africans | 32.9 /100 | #189 | Fair 3.0% |