Greek vs Immigrants from Israel Hearing Disability
COMPARE
Greek
Immigrants from Israel
Hearing Disability
Hearing Disability Comparison
Greeks
Immigrants from Israel
3.2%
HEARING DISABILITY
3.2/ 100
METRIC RATING
230th/ 347
METRIC RANK
2.6%
HEARING DISABILITY
99.3/ 100
METRIC RATING
47th/ 347
METRIC RANK
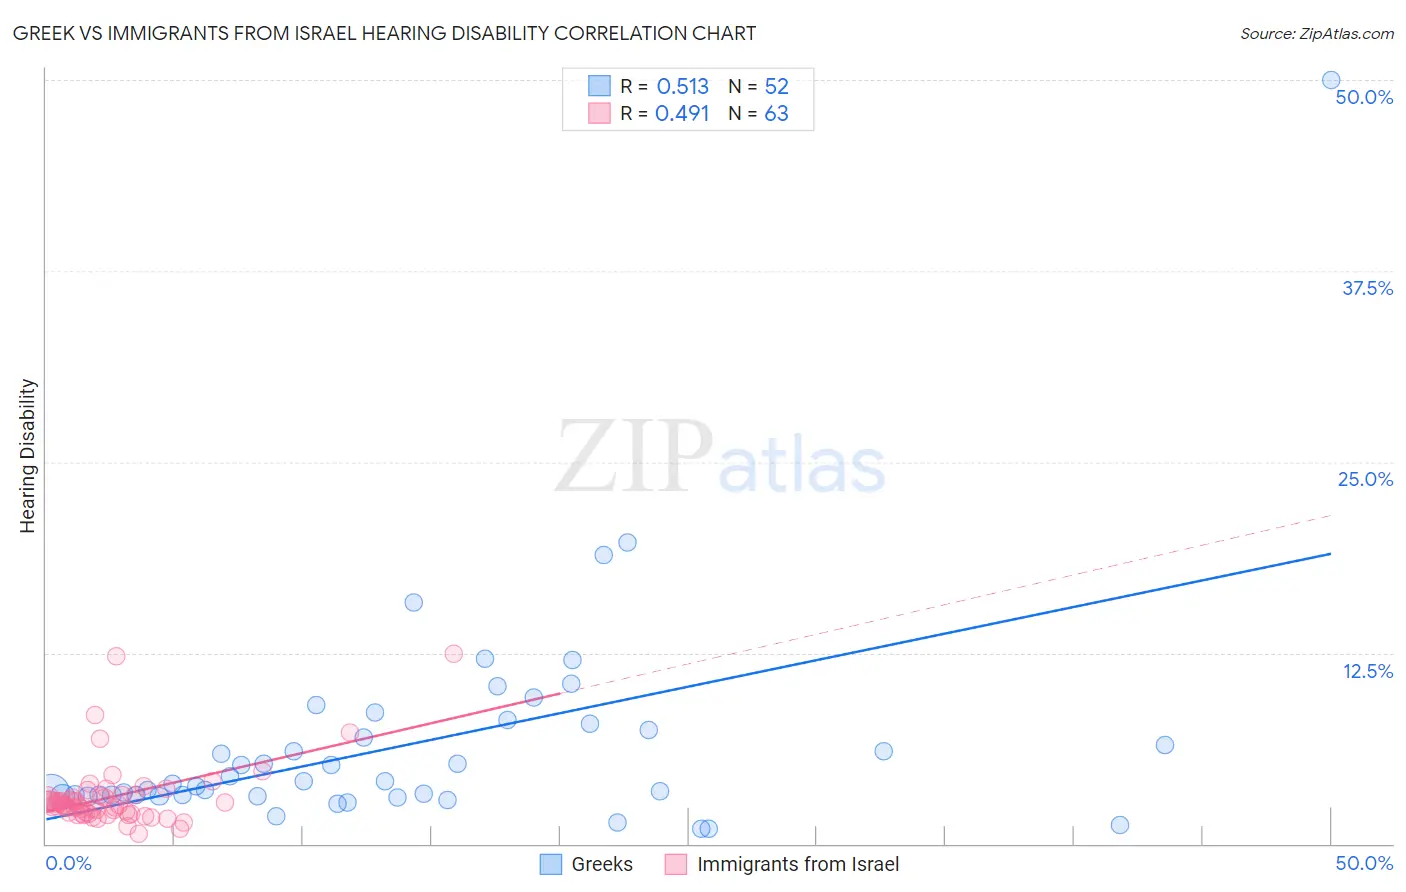
Greek vs Immigrants from Israel Hearing Disability Correlation Chart
The statistical analysis conducted on geographies consisting of 482,523,980 people shows a substantial positive correlation between the proportion of Greeks and percentage of population with hearing disability in the United States with a correlation coefficient (R) of 0.513 and weighted average of 3.2%. Similarly, the statistical analysis conducted on geographies consisting of 210,020,073 people shows a moderate positive correlation between the proportion of Immigrants from Israel and percentage of population with hearing disability in the United States with a correlation coefficient (R) of 0.491 and weighted average of 2.6%, a difference of 22.1%.
Hearing Disability Correlation Summary
| Measurement | Greek | Immigrants from Israel |
| Minimum | 1.0% | 0.64% |
| Maximum | 50.0% | 12.4% |
| Range | 49.0% | 11.8% |
| Mean | 6.5% | 3.1% |
| Median | 4.0% | 2.5% |
| Interquartile 25% (IQ1) | 3.2% | 2.0% |
| Interquartile 75% (IQ3) | 7.6% | 3.1% |
| Interquartile Range (IQR) | 4.5% | 1.1% |
| Standard Deviation (Sample) | 7.4% | 2.1% |
| Standard Deviation (Population) | 7.4% | 2.1% |
Similar Demographics by Hearing Disability
Demographics Similar to Greeks by Hearing Disability
In terms of hearing disability, the demographic groups most similar to Greeks are Luxembourger (3.2%, a difference of 0.23%), Ukrainian (3.2%, a difference of 0.28%), Maltese (3.2%, a difference of 0.51%), Immigrants from Portugal (3.2%, a difference of 0.62%), and Estonian (3.3%, a difference of 0.65%).
| Demographics | Rating | Rank | Hearing Disability |
| Mexicans | 5.6 /100 | #223 | Tragic 3.2% |
| Icelanders | 5.2 /100 | #224 | Tragic 3.2% |
| Latvians | 5.1 /100 | #225 | Tragic 3.2% |
| Lebanese | 5.0 /100 | #226 | Tragic 3.2% |
| Bhutanese | 4.6 /100 | #227 | Tragic 3.2% |
| Immigrants | Portugal | 4.3 /100 | #228 | Tragic 3.2% |
| Maltese | 4.1 /100 | #229 | Tragic 3.2% |
| Greeks | 3.2 /100 | #230 | Tragic 3.2% |
| Luxembourgers | 2.9 /100 | #231 | Tragic 3.2% |
| Ukrainians | 2.9 /100 | #232 | Tragic 3.2% |
| Estonians | 2.4 /100 | #233 | Tragic 3.3% |
| Central American Indians | 2.3 /100 | #234 | Tragic 3.3% |
| Guamanians/Chamorros | 2.2 /100 | #235 | Tragic 3.3% |
| Serbians | 2.2 /100 | #236 | Tragic 3.3% |
| Immigrants | Austria | 1.8 /100 | #237 | Tragic 3.3% |
Demographics Similar to Immigrants from Israel by Hearing Disability
In terms of hearing disability, the demographic groups most similar to Immigrants from Israel are Immigrants from Singapore (2.6%, a difference of 0.070%), Immigrants from Dominica (2.6%, a difference of 0.15%), Immigrants from South America (2.7%, a difference of 0.19%), Venezuelan (2.6%, a difference of 0.25%), and Nigerian (2.6%, a difference of 0.28%).
| Demographics | Rating | Rank | Hearing Disability |
| Haitians | 99.5 /100 | #40 | Exceptional 2.6% |
| Immigrants | Taiwan | 99.4 /100 | #41 | Exceptional 2.6% |
| West Indians | 99.4 /100 | #42 | Exceptional 2.6% |
| Senegalese | 99.4 /100 | #43 | Exceptional 2.6% |
| Nigerians | 99.4 /100 | #44 | Exceptional 2.6% |
| Venezuelans | 99.4 /100 | #45 | Exceptional 2.6% |
| Immigrants | Dominica | 99.3 /100 | #46 | Exceptional 2.6% |
| Immigrants | Israel | 99.3 /100 | #47 | Exceptional 2.6% |
| Immigrants | Singapore | 99.3 /100 | #48 | Exceptional 2.6% |
| Immigrants | South America | 99.2 /100 | #49 | Exceptional 2.7% |
| Paraguayans | 99.2 /100 | #50 | Exceptional 2.7% |
| Immigrants | Hong Kong | 99.2 /100 | #51 | Exceptional 2.7% |
| Jamaicans | 99.0 /100 | #52 | Exceptional 2.7% |
| Immigrants | Eastern Asia | 99.0 /100 | #53 | Exceptional 2.7% |
| Ethiopians | 99.0 /100 | #54 | Exceptional 2.7% |