Immigrants from Somalia vs Immigrants from Italy Hearing Disability
COMPARE
Immigrants from Somalia
Immigrants from Italy
Hearing Disability
Hearing Disability Comparison
Immigrants from Somalia
Immigrants from Italy
2.8%
HEARING DISABILITY
95.5/ 100
METRIC RATING
96th/ 347
METRIC RANK
3.0%
HEARING DISABILITY
41.1/ 100
METRIC RATING
182nd/ 347
METRIC RANK
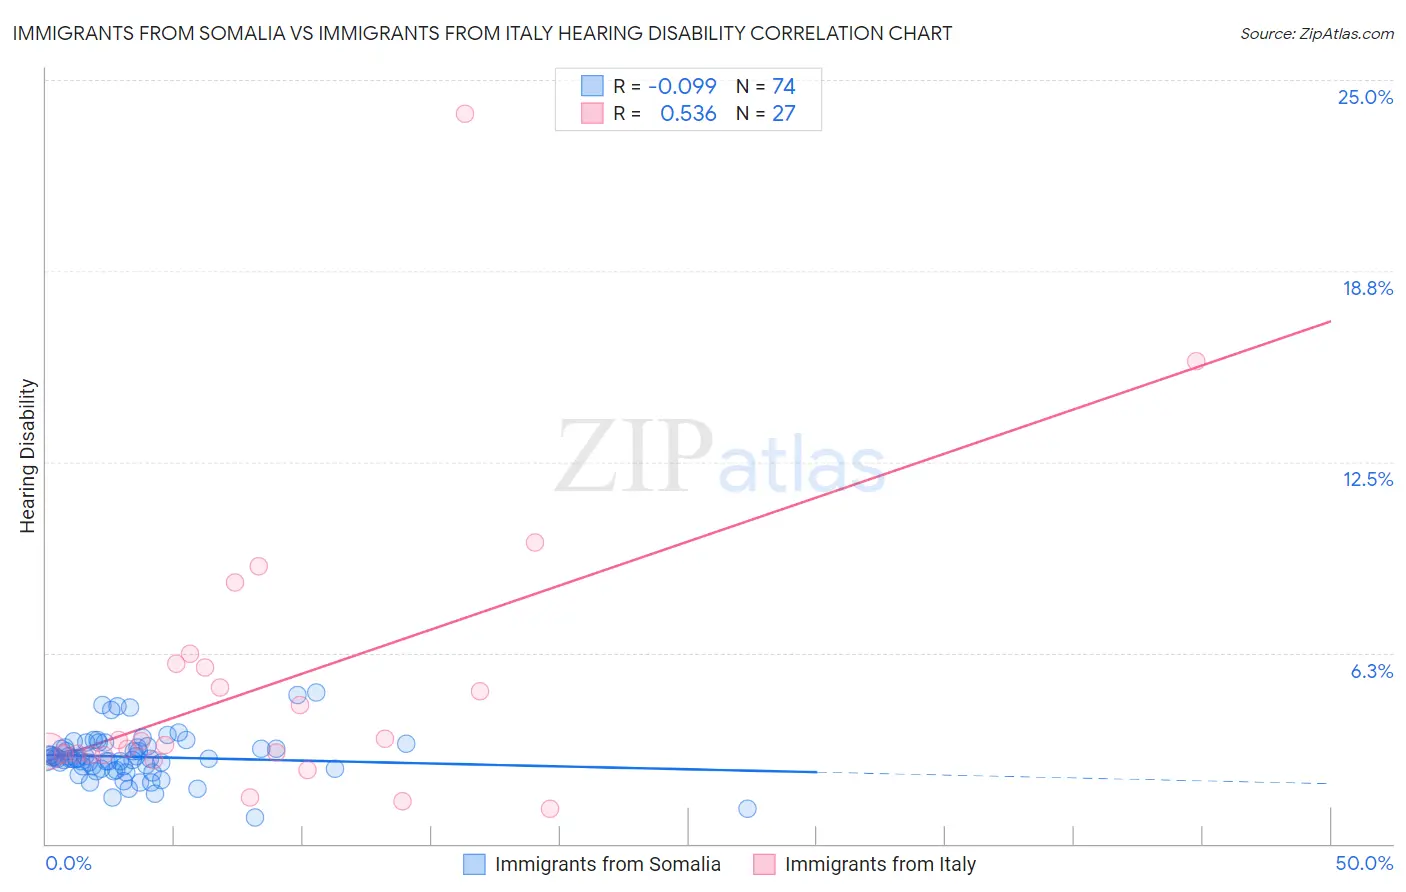
Immigrants from Somalia vs Immigrants from Italy Hearing Disability Correlation Chart
The statistical analysis conducted on geographies consisting of 92,097,804 people shows a slight negative correlation between the proportion of Immigrants from Somalia and percentage of population with hearing disability in the United States with a correlation coefficient (R) of -0.099 and weighted average of 2.8%. Similarly, the statistical analysis conducted on geographies consisting of 324,155,277 people shows a substantial positive correlation between the proportion of Immigrants from Italy and percentage of population with hearing disability in the United States with a correlation coefficient (R) of 0.536 and weighted average of 3.0%, a difference of 8.7%.
Hearing Disability Correlation Summary
| Measurement | Immigrants from Somalia | Immigrants from Italy |
| Minimum | 0.87% | 1.1% |
| Maximum | 5.0% | 23.9% |
| Range | 4.1% | 22.8% |
| Mean | 2.8% | 5.3% |
| Median | 2.8% | 3.3% |
| Interquartile 25% (IQ1) | 2.5% | 2.9% |
| Interquartile 75% (IQ3) | 3.2% | 5.9% |
| Interquartile Range (IQR) | 0.69% | 3.0% |
| Standard Deviation (Sample) | 0.75% | 4.9% |
| Standard Deviation (Population) | 0.75% | 4.8% |
Similar Demographics by Hearing Disability
Demographics Similar to Immigrants from Somalia by Hearing Disability
In terms of hearing disability, the demographic groups most similar to Immigrants from Somalia are Immigrants from Afghanistan (2.8%, a difference of 0.17%), Israeli (2.8%, a difference of 0.19%), Uruguayan (2.8%, a difference of 0.21%), Immigrants from Honduras (2.8%, a difference of 0.23%), and Immigrants from Guatemala (2.8%, a difference of 0.27%).
| Demographics | Rating | Rank | Hearing Disability |
| Belizeans | 96.6 /100 | #89 | Exceptional 2.8% |
| Immigrants | Morocco | 96.6 /100 | #90 | Exceptional 2.8% |
| Immigrants | Middle Africa | 96.5 /100 | #91 | Exceptional 2.8% |
| Iranians | 96.4 /100 | #92 | Exceptional 2.8% |
| Immigrants | Kuwait | 96.3 /100 | #93 | Exceptional 2.8% |
| Uruguayans | 95.9 /100 | #94 | Exceptional 2.8% |
| Israelis | 95.9 /100 | #95 | Exceptional 2.8% |
| Immigrants | Somalia | 95.5 /100 | #96 | Exceptional 2.8% |
| Immigrants | Afghanistan | 95.3 /100 | #97 | Exceptional 2.8% |
| Immigrants | Honduras | 95.1 /100 | #98 | Exceptional 2.8% |
| Immigrants | Guatemala | 95.1 /100 | #99 | Exceptional 2.8% |
| Immigrants | Eastern Africa | 95.0 /100 | #100 | Exceptional 2.8% |
| Immigrants | Spain | 94.9 /100 | #101 | Exceptional 2.8% |
| Taiwanese | 94.8 /100 | #102 | Exceptional 2.8% |
| Immigrants | Indonesia | 94.7 /100 | #103 | Exceptional 2.8% |
Demographics Similar to Immigrants from Italy by Hearing Disability
In terms of hearing disability, the demographic groups most similar to Immigrants from Italy are Immigrants from Belgium (3.0%, a difference of 0.030%), Immigrants from Sweden (3.0%, a difference of 0.12%), Bulgarian (3.0%, a difference of 0.14%), Immigrants from Moldova (3.0%, a difference of 0.18%), and Immigrants from Ireland (3.0%, a difference of 0.37%).
| Demographics | Rating | Rank | Hearing Disability |
| Immigrants | Romania | 48.4 /100 | #175 | Average 3.0% |
| Panamanians | 47.0 /100 | #176 | Average 3.0% |
| Immigrants | Philippines | 46.4 /100 | #177 | Average 3.0% |
| Japanese | 46.0 /100 | #178 | Average 3.0% |
| Immigrants | Moldova | 43.1 /100 | #179 | Average 3.0% |
| Immigrants | Sweden | 42.4 /100 | #180 | Average 3.0% |
| Immigrants | Belgium | 41.5 /100 | #181 | Average 3.0% |
| Immigrants | Italy | 41.1 /100 | #182 | Average 3.0% |
| Bulgarians | 39.7 /100 | #183 | Fair 3.0% |
| Immigrants | Ireland | 37.4 /100 | #184 | Fair 3.0% |
| Immigrants | Southern Europe | 35.3 /100 | #185 | Fair 3.0% |
| Immigrants | Mexico | 34.9 /100 | #186 | Fair 3.0% |
| Blacks/African Americans | 34.7 /100 | #187 | Fair 3.0% |
| Mexican American Indians | 34.7 /100 | #188 | Fair 3.0% |
| Africans | 32.9 /100 | #189 | Fair 3.0% |