Greek vs Spanish Hearing Disability
COMPARE
Greek
Spanish
Hearing Disability
Hearing Disability Comparison
Greeks
Spanish
3.2%
HEARING DISABILITY
3.2/ 100
METRIC RATING
230th/ 347
METRIC RANK
3.7%
HEARING DISABILITY
0.0/ 100
METRIC RATING
287th/ 347
METRIC RANK
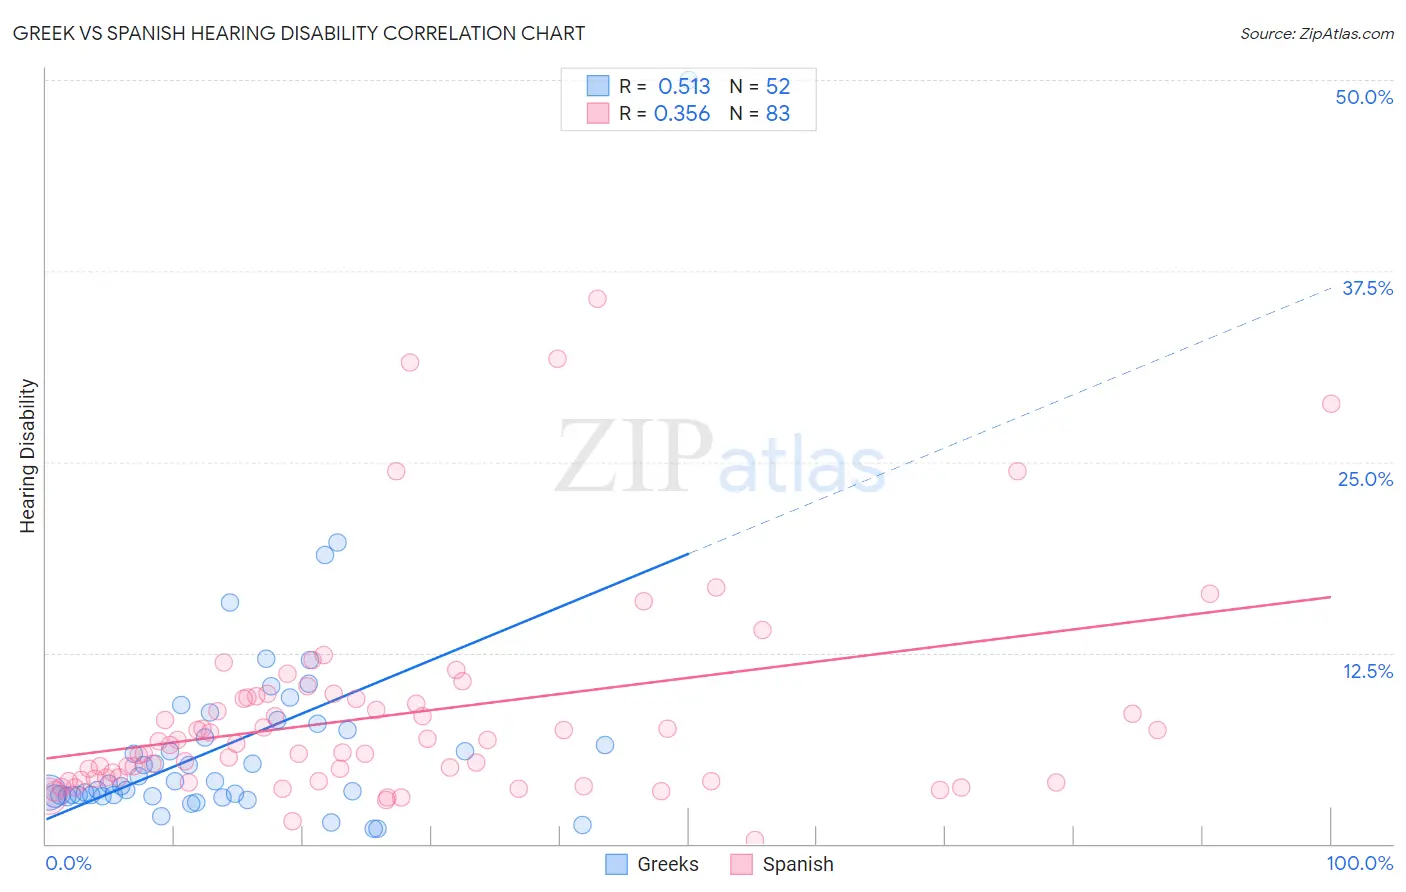
Greek vs Spanish Hearing Disability Correlation Chart
The statistical analysis conducted on geographies consisting of 482,523,980 people shows a substantial positive correlation between the proportion of Greeks and percentage of population with hearing disability in the United States with a correlation coefficient (R) of 0.513 and weighted average of 3.2%. Similarly, the statistical analysis conducted on geographies consisting of 421,995,316 people shows a mild positive correlation between the proportion of Spanish and percentage of population with hearing disability in the United States with a correlation coefficient (R) of 0.356 and weighted average of 3.7%, a difference of 12.9%.
Hearing Disability Correlation Summary
| Measurement | Greek | Spanish |
| Minimum | 1.0% | 0.21% |
| Maximum | 50.0% | 35.7% |
| Range | 49.0% | 35.5% |
| Mean | 6.5% | 8.4% |
| Median | 4.0% | 6.5% |
| Interquartile 25% (IQ1) | 3.2% | 4.1% |
| Interquartile 75% (IQ3) | 7.6% | 9.6% |
| Interquartile Range (IQR) | 4.5% | 5.5% |
| Standard Deviation (Sample) | 7.4% | 6.8% |
| Standard Deviation (Population) | 7.4% | 6.8% |
Similar Demographics by Hearing Disability
Demographics Similar to Greeks by Hearing Disability
In terms of hearing disability, the demographic groups most similar to Greeks are Luxembourger (3.2%, a difference of 0.23%), Ukrainian (3.2%, a difference of 0.28%), Maltese (3.2%, a difference of 0.51%), Immigrants from Portugal (3.2%, a difference of 0.62%), and Estonian (3.3%, a difference of 0.65%).
| Demographics | Rating | Rank | Hearing Disability |
| Mexicans | 5.6 /100 | #223 | Tragic 3.2% |
| Icelanders | 5.2 /100 | #224 | Tragic 3.2% |
| Latvians | 5.1 /100 | #225 | Tragic 3.2% |
| Lebanese | 5.0 /100 | #226 | Tragic 3.2% |
| Bhutanese | 4.6 /100 | #227 | Tragic 3.2% |
| Immigrants | Portugal | 4.3 /100 | #228 | Tragic 3.2% |
| Maltese | 4.1 /100 | #229 | Tragic 3.2% |
| Greeks | 3.2 /100 | #230 | Tragic 3.2% |
| Luxembourgers | 2.9 /100 | #231 | Tragic 3.2% |
| Ukrainians | 2.9 /100 | #232 | Tragic 3.2% |
| Estonians | 2.4 /100 | #233 | Tragic 3.3% |
| Central American Indians | 2.3 /100 | #234 | Tragic 3.3% |
| Guamanians/Chamorros | 2.2 /100 | #235 | Tragic 3.3% |
| Serbians | 2.2 /100 | #236 | Tragic 3.3% |
| Immigrants | Austria | 1.8 /100 | #237 | Tragic 3.3% |
Demographics Similar to Spanish by Hearing Disability
In terms of hearing disability, the demographic groups most similar to Spanish are Delaware (3.6%, a difference of 0.24%), Sioux (3.6%, a difference of 0.28%), Immigrants from Micronesia (3.6%, a difference of 0.38%), Irish (3.7%, a difference of 0.57%), and Chinese (3.7%, a difference of 0.78%).
| Demographics | Rating | Rank | Hearing Disability |
| French American Indians | 0.0 /100 | #280 | Tragic 3.6% |
| Scandinavians | 0.0 /100 | #281 | Tragic 3.6% |
| Swedes | 0.0 /100 | #282 | Tragic 3.6% |
| Blackfeet | 0.0 /100 | #283 | Tragic 3.6% |
| Immigrants | Micronesia | 0.0 /100 | #284 | Tragic 3.6% |
| Sioux | 0.0 /100 | #285 | Tragic 3.6% |
| Delaware | 0.0 /100 | #286 | Tragic 3.6% |
| Spanish | 0.0 /100 | #287 | Tragic 3.7% |
| Irish | 0.0 /100 | #288 | Tragic 3.7% |
| Chinese | 0.0 /100 | #289 | Tragic 3.7% |
| Whites/Caucasians | 0.0 /100 | #290 | Tragic 3.7% |
| Finns | 0.0 /100 | #291 | Tragic 3.7% |
| Native Hawaiians | 0.0 /100 | #292 | Tragic 3.7% |
| Norwegians | 0.0 /100 | #293 | Tragic 3.7% |
| Iroquois | 0.0 /100 | #294 | Tragic 3.7% |