Greek vs Immigrants from Italy College, 1 year or more
COMPARE
Greek
Immigrants from Italy
College, 1 year or more
College, 1 year or more Comparison
Greeks
Immigrants from Italy
62.6%
COLLEGE, 1 YEAR OR MORE
98.3/ 100
METRIC RATING
88th/ 347
METRIC RANK
61.2%
COLLEGE, 1 YEAR OR MORE
91.1/ 100
METRIC RATING
128th/ 347
METRIC RANK
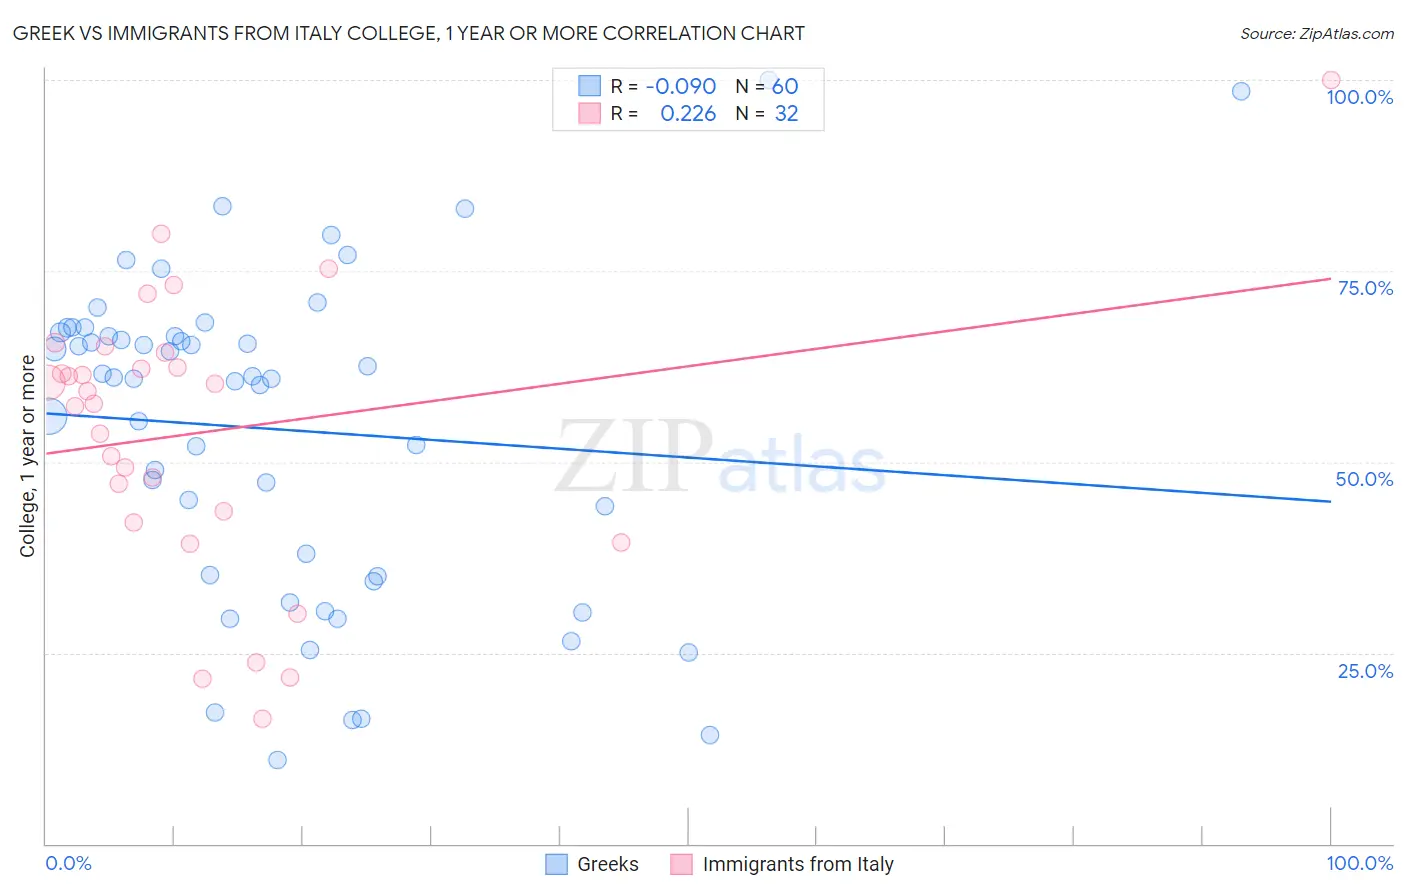
Greek vs Immigrants from Italy College, 1 year or more Correlation Chart
The statistical analysis conducted on geographies consisting of 482,770,265 people shows a slight negative correlation between the proportion of Greeks and percentage of population with at least college, 1 year or more education in the United States with a correlation coefficient (R) of -0.090 and weighted average of 62.6%. Similarly, the statistical analysis conducted on geographies consisting of 324,223,988 people shows a weak positive correlation between the proportion of Immigrants from Italy and percentage of population with at least college, 1 year or more education in the United States with a correlation coefficient (R) of 0.226 and weighted average of 61.2%, a difference of 2.3%.
College, 1 year or more Correlation Summary
| Measurement | Greek | Immigrants from Italy |
| Minimum | 10.9% | 16.4% |
| Maximum | 100.0% | 100.0% |
| Range | 89.1% | 83.6% |
| Mean | 54.3% | 53.9% |
| Median | 61.0% | 58.4% |
| Interquartile 25% (IQ1) | 35.1% | 42.8% |
| Interquartile 75% (IQ3) | 66.7% | 63.3% |
| Interquartile Range (IQR) | 31.6% | 20.4% |
| Standard Deviation (Sample) | 20.9% | 18.4% |
| Standard Deviation (Population) | 20.8% | 18.1% |
Similar Demographics by College, 1 year or more
Demographics Similar to Greeks by College, 1 year or more
In terms of college, 1 year or more, the demographic groups most similar to Greeks are Immigrants from Ethiopia (62.6%, a difference of 0.10%), Immigrants from Hungary (62.7%, a difference of 0.17%), Immigrants from Western Europe (62.7%, a difference of 0.19%), Immigrants from Pakistan (62.8%, a difference of 0.21%), and Immigrants from England (62.8%, a difference of 0.22%).
| Demographics | Rating | Rank | College, 1 year or more |
| Laotians | 98.7 /100 | #81 | Exceptional 62.8% |
| Immigrants | Bolivia | 98.7 /100 | #82 | Exceptional 62.8% |
| Immigrants | Argentina | 98.6 /100 | #83 | Exceptional 62.8% |
| Immigrants | England | 98.6 /100 | #84 | Exceptional 62.8% |
| Immigrants | Pakistan | 98.6 /100 | #85 | Exceptional 62.8% |
| Immigrants | Western Europe | 98.6 /100 | #86 | Exceptional 62.7% |
| Immigrants | Hungary | 98.6 /100 | #87 | Exceptional 62.7% |
| Greeks | 98.3 /100 | #88 | Exceptional 62.6% |
| Immigrants | Ethiopia | 98.2 /100 | #89 | Exceptional 62.6% |
| Immigrants | Western Asia | 97.9 /100 | #90 | Exceptional 62.5% |
| Immigrants | Eastern Europe | 97.8 /100 | #91 | Exceptional 62.4% |
| Immigrants | Egypt | 97.8 /100 | #92 | Exceptional 62.4% |
| Romanians | 97.7 /100 | #93 | Exceptional 62.4% |
| Immigrants | Croatia | 97.6 /100 | #94 | Exceptional 62.3% |
| British | 97.4 /100 | #95 | Exceptional 62.3% |
Demographics Similar to Immigrants from Italy by College, 1 year or more
In terms of college, 1 year or more, the demographic groups most similar to Immigrants from Italy are Immigrants from Eastern Africa (61.2%, a difference of 0.0%), Alsatian (61.3%, a difference of 0.030%), Ugandan (61.2%, a difference of 0.060%), Immigrants from Syria (61.3%, a difference of 0.080%), and Venezuelan (61.3%, a difference of 0.16%).
| Demographics | Rating | Rank | College, 1 year or more |
| Immigrants | Jordan | 92.7 /100 | #121 | Exceptional 61.4% |
| Immigrants | Chile | 92.3 /100 | #122 | Exceptional 61.4% |
| Serbians | 92.2 /100 | #123 | Exceptional 61.4% |
| Venezuelans | 92.1 /100 | #124 | Exceptional 61.3% |
| Immigrants | Syria | 91.6 /100 | #125 | Exceptional 61.3% |
| Alsatians | 91.3 /100 | #126 | Exceptional 61.3% |
| Immigrants | Eastern Africa | 91.1 /100 | #127 | Exceptional 61.2% |
| Immigrants | Italy | 91.1 /100 | #128 | Exceptional 61.2% |
| Ugandans | 90.7 /100 | #129 | Exceptional 61.2% |
| Italians | 89.5 /100 | #130 | Excellent 61.1% |
| Immigrants | Morocco | 89.5 /100 | #131 | Excellent 61.1% |
| Scandinavians | 88.2 /100 | #132 | Excellent 61.0% |
| Immigrants | Uzbekistan | 88.0 /100 | #133 | Excellent 61.0% |
| Immigrants | Venezuela | 87.9 /100 | #134 | Excellent 61.0% |
| Immigrants | Uganda | 87.4 /100 | #135 | Excellent 60.9% |