Afghan vs Immigrants from Italy Hearing Disability
COMPARE
Afghan
Immigrants from Italy
Hearing Disability
Hearing Disability Comparison
Afghans
Immigrants from Italy
2.7%
HEARING DISABILITY
97.6/ 100
METRIC RATING
72nd/ 347
METRIC RANK
3.0%
HEARING DISABILITY
41.1/ 100
METRIC RATING
182nd/ 347
METRIC RANK
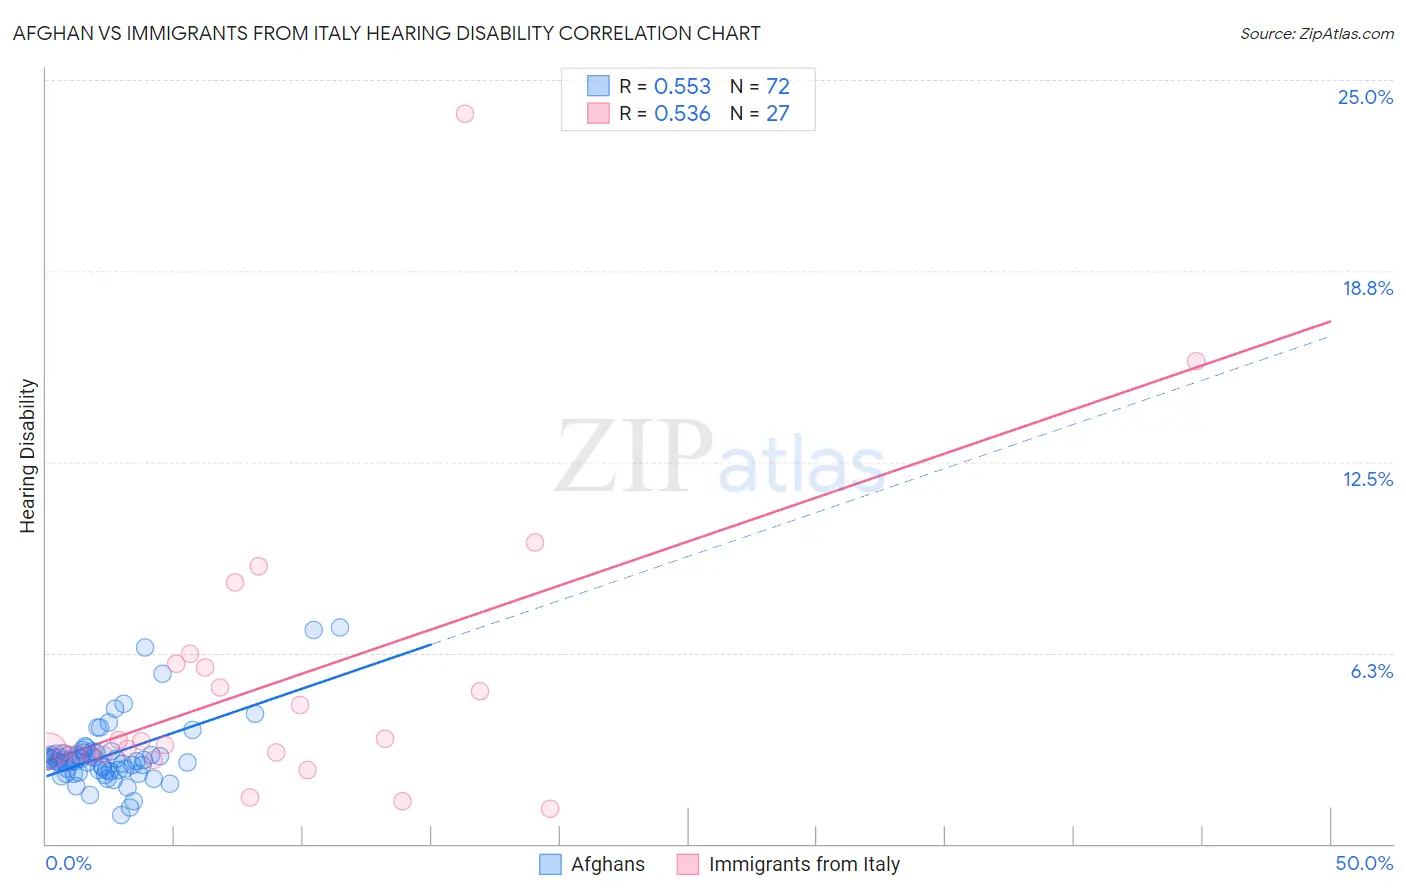
Afghan vs Immigrants from Italy Hearing Disability Correlation Chart
The statistical analysis conducted on geographies consisting of 148,839,750 people shows a substantial positive correlation between the proportion of Afghans and percentage of population with hearing disability in the United States with a correlation coefficient (R) of 0.553 and weighted average of 2.7%. Similarly, the statistical analysis conducted on geographies consisting of 324,155,277 people shows a substantial positive correlation between the proportion of Immigrants from Italy and percentage of population with hearing disability in the United States with a correlation coefficient (R) of 0.536 and weighted average of 3.0%, a difference of 10.4%.
Hearing Disability Correlation Summary
| Measurement | Afghan | Immigrants from Italy |
| Minimum | 0.95% | 1.1% |
| Maximum | 7.1% | 23.9% |
| Range | 6.1% | 22.8% |
| Mean | 2.9% | 5.3% |
| Median | 2.7% | 3.3% |
| Interquartile 25% (IQ1) | 2.4% | 2.9% |
| Interquartile 75% (IQ3) | 3.0% | 5.9% |
| Interquartile Range (IQR) | 0.55% | 3.0% |
| Standard Deviation (Sample) | 1.1% | 4.9% |
| Standard Deviation (Population) | 1.1% | 4.8% |
Similar Demographics by Hearing Disability
Demographics Similar to Afghans by Hearing Disability
In terms of hearing disability, the demographic groups most similar to Afghans are Argentinean (2.7%, a difference of 0.080%), Immigrants from Korea (2.7%, a difference of 0.080%), Central American (2.7%, a difference of 0.10%), Immigrants from Saudi Arabia (2.7%, a difference of 0.11%), and Asian (2.7%, a difference of 0.11%).
| Demographics | Rating | Rank | Hearing Disability |
| Immigrants | Nepal | 98.3 /100 | #65 | Exceptional 2.7% |
| Immigrants | Belize | 98.2 /100 | #66 | Exceptional 2.7% |
| Egyptians | 98.1 /100 | #67 | Exceptional 2.7% |
| Immigrants | Africa | 98.0 /100 | #68 | Exceptional 2.7% |
| Nicaraguans | 97.9 /100 | #69 | Exceptional 2.7% |
| Peruvians | 97.7 /100 | #70 | Exceptional 2.7% |
| Central Americans | 97.7 /100 | #71 | Exceptional 2.7% |
| Afghans | 97.6 /100 | #72 | Exceptional 2.7% |
| Argentineans | 97.5 /100 | #73 | Exceptional 2.7% |
| Immigrants | Korea | 97.5 /100 | #74 | Exceptional 2.7% |
| Immigrants | Saudi Arabia | 97.5 /100 | #75 | Exceptional 2.7% |
| Asians | 97.5 /100 | #76 | Exceptional 2.7% |
| Immigrants | Malaysia | 97.5 /100 | #77 | Exceptional 2.7% |
| Mongolians | 97.4 /100 | #78 | Exceptional 2.7% |
| Colombians | 97.4 /100 | #79 | Exceptional 2.7% |
Demographics Similar to Immigrants from Italy by Hearing Disability
In terms of hearing disability, the demographic groups most similar to Immigrants from Italy are Immigrants from Belgium (3.0%, a difference of 0.030%), Immigrants from Sweden (3.0%, a difference of 0.12%), Bulgarian (3.0%, a difference of 0.14%), Immigrants from Moldova (3.0%, a difference of 0.18%), and Immigrants from Ireland (3.0%, a difference of 0.37%).
| Demographics | Rating | Rank | Hearing Disability |
| Immigrants | Romania | 48.4 /100 | #175 | Average 3.0% |
| Panamanians | 47.0 /100 | #176 | Average 3.0% |
| Immigrants | Philippines | 46.4 /100 | #177 | Average 3.0% |
| Japanese | 46.0 /100 | #178 | Average 3.0% |
| Immigrants | Moldova | 43.1 /100 | #179 | Average 3.0% |
| Immigrants | Sweden | 42.4 /100 | #180 | Average 3.0% |
| Immigrants | Belgium | 41.5 /100 | #181 | Average 3.0% |
| Immigrants | Italy | 41.1 /100 | #182 | Average 3.0% |
| Bulgarians | 39.7 /100 | #183 | Fair 3.0% |
| Immigrants | Ireland | 37.4 /100 | #184 | Fair 3.0% |
| Immigrants | Southern Europe | 35.3 /100 | #185 | Fair 3.0% |
| Immigrants | Mexico | 34.9 /100 | #186 | Fair 3.0% |
| Blacks/African Americans | 34.7 /100 | #187 | Fair 3.0% |
| Mexican American Indians | 34.7 /100 | #188 | Fair 3.0% |
| Africans | 32.9 /100 | #189 | Fair 3.0% |