Bulgarian vs Immigrants from Italy Hearing Disability
COMPARE
Bulgarian
Immigrants from Italy
Hearing Disability
Hearing Disability Comparison
Bulgarians
Immigrants from Italy
3.0%
HEARING DISABILITY
39.7/ 100
METRIC RATING
183rd/ 347
METRIC RANK
3.0%
HEARING DISABILITY
41.1/ 100
METRIC RATING
182nd/ 347
METRIC RANK
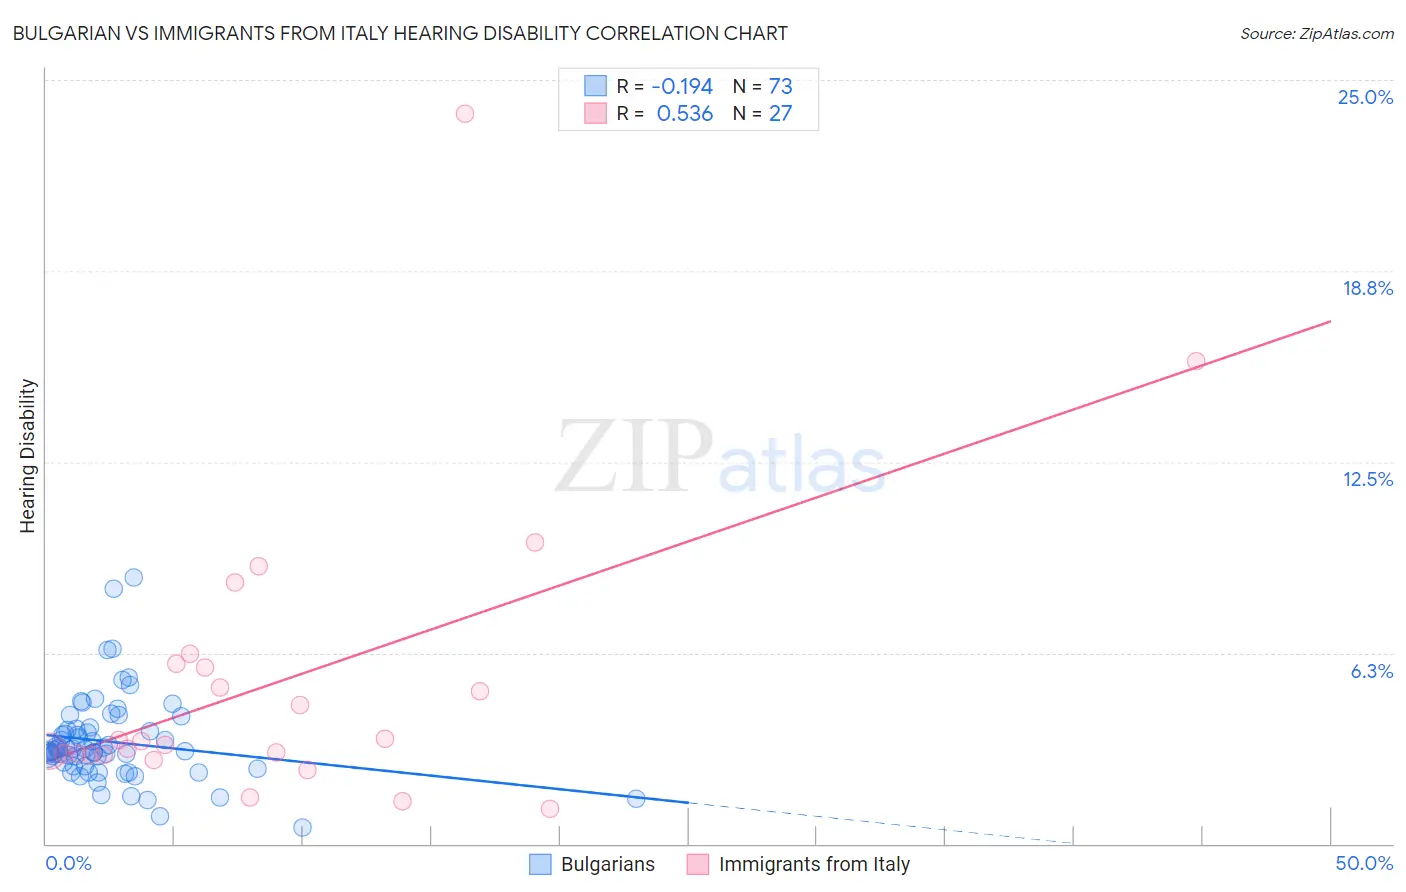
Bulgarian vs Immigrants from Italy Hearing Disability Correlation Chart
The statistical analysis conducted on geographies consisting of 205,610,417 people shows a poor negative correlation between the proportion of Bulgarians and percentage of population with hearing disability in the United States with a correlation coefficient (R) of -0.194 and weighted average of 3.0%. Similarly, the statistical analysis conducted on geographies consisting of 324,155,277 people shows a substantial positive correlation between the proportion of Immigrants from Italy and percentage of population with hearing disability in the United States with a correlation coefficient (R) of 0.536 and weighted average of 3.0%, a difference of 0.14%.
Hearing Disability Correlation Summary
| Measurement | Bulgarian | Immigrants from Italy |
| Minimum | 0.54% | 1.1% |
| Maximum | 8.7% | 23.9% |
| Range | 8.2% | 22.8% |
| Mean | 3.3% | 5.3% |
| Median | 3.1% | 3.3% |
| Interquartile 25% (IQ1) | 2.5% | 2.9% |
| Interquartile 75% (IQ3) | 3.7% | 5.9% |
| Interquartile Range (IQR) | 1.2% | 3.0% |
| Standard Deviation (Sample) | 1.4% | 4.9% |
| Standard Deviation (Population) | 1.4% | 4.8% |
Demographics Similar to Bulgarians and Immigrants from Italy by Hearing Disability
In terms of hearing disability, the demographic groups most similar to Bulgarians are Immigrants from Belgium (3.0%, a difference of 0.17%), Immigrants from Ireland (3.0%, a difference of 0.23%), Immigrants from Sweden (3.0%, a difference of 0.26%), Immigrants from Moldova (3.0%, a difference of 0.32%), and Immigrants from Southern Europe (3.0%, a difference of 0.44%). Similarly, the demographic groups most similar to Immigrants from Italy are Immigrants from Belgium (3.0%, a difference of 0.030%), Immigrants from Sweden (3.0%, a difference of 0.12%), Immigrants from Moldova (3.0%, a difference of 0.18%), Immigrants from Ireland (3.0%, a difference of 0.37%), and Japanese (3.0%, a difference of 0.46%).
| Demographics | Rating | Rank | Hearing Disability |
| Armenians | 56.0 /100 | #172 | Average 3.0% |
| Immigrants | Serbia | 51.1 /100 | #173 | Average 3.0% |
| Indonesians | 50.0 /100 | #174 | Average 3.0% |
| Immigrants | Romania | 48.4 /100 | #175 | Average 3.0% |
| Panamanians | 47.0 /100 | #176 | Average 3.0% |
| Immigrants | Philippines | 46.4 /100 | #177 | Average 3.0% |
| Japanese | 46.0 /100 | #178 | Average 3.0% |
| Immigrants | Moldova | 43.1 /100 | #179 | Average 3.0% |
| Immigrants | Sweden | 42.4 /100 | #180 | Average 3.0% |
| Immigrants | Belgium | 41.5 /100 | #181 | Average 3.0% |
| Immigrants | Italy | 41.1 /100 | #182 | Average 3.0% |
| Bulgarians | 39.7 /100 | #183 | Fair 3.0% |
| Immigrants | Ireland | 37.4 /100 | #184 | Fair 3.0% |
| Immigrants | Southern Europe | 35.3 /100 | #185 | Fair 3.0% |
| Immigrants | Mexico | 34.9 /100 | #186 | Fair 3.0% |
| Blacks/African Americans | 34.7 /100 | #187 | Fair 3.0% |
| Mexican American Indians | 34.7 /100 | #188 | Fair 3.0% |
| Africans | 32.9 /100 | #189 | Fair 3.0% |
| Immigrants | South Africa | 31.1 /100 | #190 | Fair 3.1% |
| Immigrants | Switzerland | 28.8 /100 | #191 | Fair 3.1% |
| Koreans | 27.6 /100 | #192 | Fair 3.1% |