French vs Jamaican Disability
COMPARE
French
Jamaican
Disability
Disability Comparison
French
Jamaicans
13.2%
DISABILITY
0.0/ 100
METRIC RATING
299th/ 347
METRIC RANK
12.1%
DISABILITY
3.3/ 100
METRIC RATING
226th/ 347
METRIC RANK
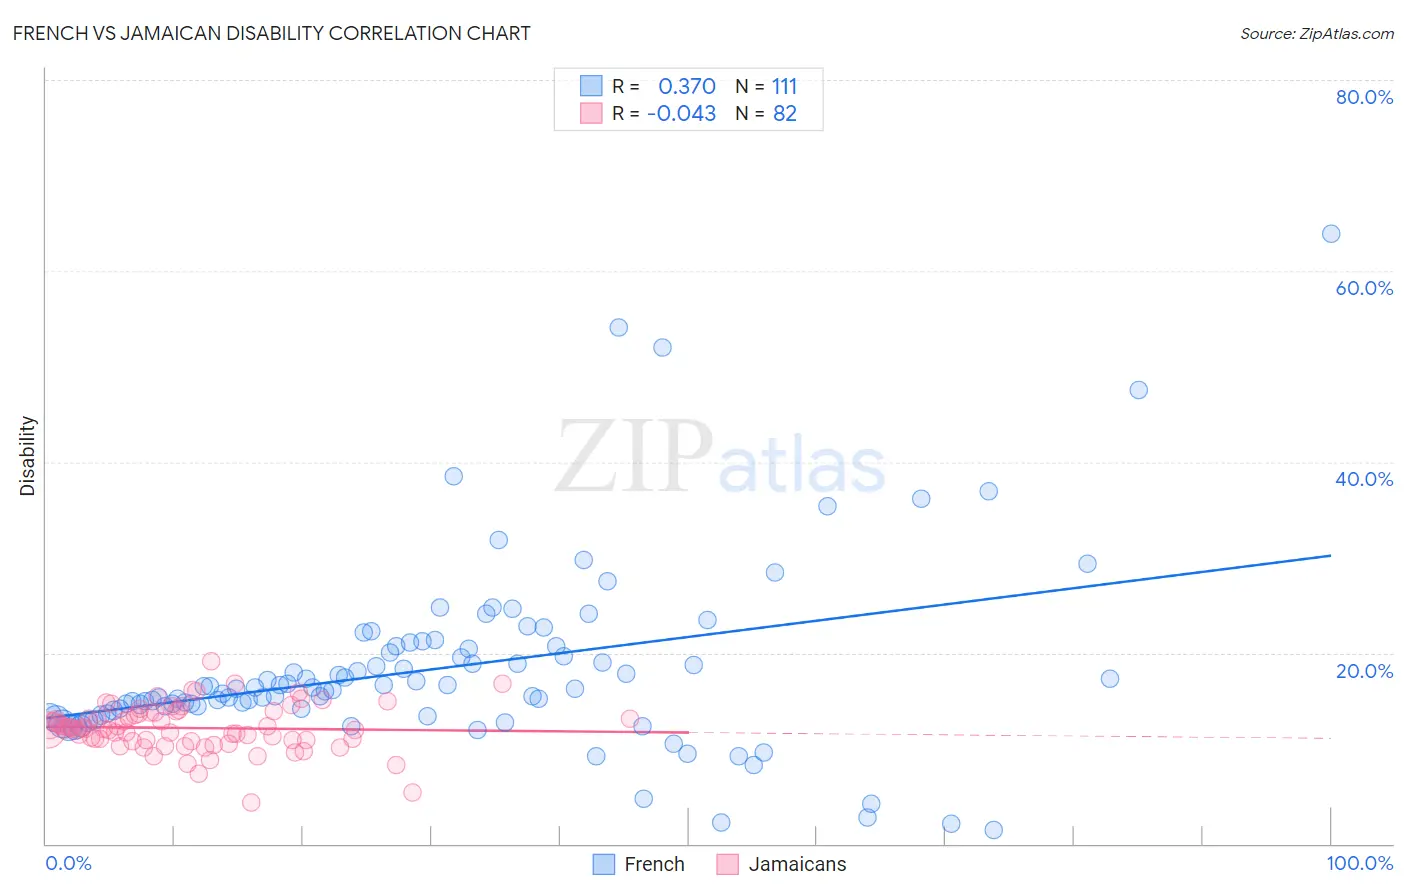
French vs Jamaican Disability Correlation Chart
The statistical analysis conducted on geographies consisting of 572,283,731 people shows a mild positive correlation between the proportion of French and percentage of population with a disability in the United States with a correlation coefficient (R) of 0.370 and weighted average of 13.2%. Similarly, the statistical analysis conducted on geographies consisting of 367,991,297 people shows no correlation between the proportion of Jamaicans and percentage of population with a disability in the United States with a correlation coefficient (R) of -0.043 and weighted average of 12.1%, a difference of 8.5%.
Disability Correlation Summary
| Measurement | French | Jamaican |
| Minimum | 1.5% | 4.3% |
| Maximum | 63.9% | 19.1% |
| Range | 62.4% | 14.8% |
| Mean | 18.3% | 12.1% |
| Median | 16.2% | 12.0% |
| Interquartile 25% (IQ1) | 13.9% | 10.8% |
| Interquartile 75% (IQ3) | 20.7% | 13.7% |
| Interquartile Range (IQR) | 6.7% | 2.9% |
| Standard Deviation (Sample) | 9.7% | 2.4% |
| Standard Deviation (Population) | 9.7% | 2.4% |
Similar Demographics by Disability
Demographics Similar to French by Disability
In terms of disability, the demographic groups most similar to French are Alaska Native (13.2%, a difference of 0.020%), Hopi (13.2%, a difference of 0.030%), Pennsylvania German (13.2%, a difference of 0.050%), Central American Indian (13.2%, a difference of 0.080%), and Nonimmigrants (13.2%, a difference of 0.12%).
| Demographics | Rating | Rank | Disability |
| Aleuts | 0.0 /100 | #292 | Tragic 13.1% |
| Marshallese | 0.0 /100 | #293 | Tragic 13.1% |
| Celtics | 0.0 /100 | #294 | Tragic 13.1% |
| Immigrants | Nonimmigrants | 0.0 /100 | #295 | Tragic 13.2% |
| Central American Indians | 0.0 /100 | #296 | Tragic 13.2% |
| Hopi | 0.0 /100 | #297 | Tragic 13.2% |
| Alaska Natives | 0.0 /100 | #298 | Tragic 13.2% |
| French | 0.0 /100 | #299 | Tragic 13.2% |
| Pennsylvania Germans | 0.0 /100 | #300 | Tragic 13.2% |
| Immigrants | Micronesia | 0.0 /100 | #301 | Tragic 13.2% |
| Arapaho | 0.0 /100 | #302 | Tragic 13.2% |
| Scotch-Irish | 0.0 /100 | #303 | Tragic 13.3% |
| Yakama | 0.0 /100 | #304 | Tragic 13.4% |
| French Canadians | 0.0 /100 | #305 | Tragic 13.4% |
| Cape Verdeans | 0.0 /100 | #306 | Tragic 13.5% |
Demographics Similar to Jamaicans by Disability
In terms of disability, the demographic groups most similar to Jamaicans are Alsatian (12.1%, a difference of 0.010%), Senegalese (12.1%, a difference of 0.050%), Mexican (12.1%, a difference of 0.13%), West Indian (12.2%, a difference of 0.15%), and Inupiat (12.2%, a difference of 0.17%).
| Demographics | Rating | Rank | Disability |
| Croatians | 4.9 /100 | #219 | Tragic 12.1% |
| Immigrants | Bahamas | 4.7 /100 | #220 | Tragic 12.1% |
| Northern Europeans | 4.2 /100 | #221 | Tragic 12.1% |
| Spanish American Indians | 4.1 /100 | #222 | Tragic 12.1% |
| Hispanics or Latinos | 3.9 /100 | #223 | Tragic 12.1% |
| Mexicans | 3.7 /100 | #224 | Tragic 12.1% |
| Senegalese | 3.5 /100 | #225 | Tragic 12.1% |
| Jamaicans | 3.3 /100 | #226 | Tragic 12.1% |
| Alsatians | 3.3 /100 | #227 | Tragic 12.1% |
| West Indians | 2.9 /100 | #228 | Tragic 12.2% |
| Inupiat | 2.8 /100 | #229 | Tragic 12.2% |
| Samoans | 2.6 /100 | #230 | Tragic 12.2% |
| Malaysians | 2.5 /100 | #231 | Tragic 12.2% |
| Italians | 2.5 /100 | #232 | Tragic 12.2% |
| Bahamians | 2.3 /100 | #233 | Tragic 12.2% |